-
Surging Video Consumption Drives Cisco's Mobile Traffic Forecast
Last summer I wrote about Cisco's Visual Networking Index, a model that the company originally built to forecast traffic for its own internal planning, but which it now releases externally as well. Cisco's methodology is to combine analyst projections with data that it collects from its own customers.
Yesterday Cisco released an updated forecast focused on mobile traffic, which is an area of intense interest
 for many, in light of the huge success of the iPhone and the App Store. Once again Cisco has given me permission to make available the forecast slides for complimentary download. It was a pretty long deck so I've culled out the most salient slides.
 Cisco is forecasting mobile traffic will grow 66x from 2008-2013 to 2.5 million terabytes/mo. The primary driver of that growth is video, which it believes will account for 64% of mobile traffic in '13, more than triple data's 19% share. Cisco believes that most of the mobile video consumed will be on demand, not streamed live.
As for devices that will fuel all this growth, Cisco believes that handsets (primarily smartphones) will account for 53% of traffic, and portable devices (primarily laptops using aircards) will account for 40%. According to its analysis, smartphones generate at least 30x the mobile traffic that standard handsets do, while laptops generate 450x the traffic of handsets. The forecast slides also break out growth by traffic type in each region of the world.
I've said in the past that although mobile video is lagging broadband fixed line video today, it is poised to quickly catch up. All of this traffic growth of course creates both issues and opportunities for wireless carriers. Soon enough consumers are going to expect that they can take their full video experience on the road with them. It's an exciting vision.
What do you think? Post a comment now.
Categories: Mobile Video
Topics: Cisco
-
New Research from Starz on Media Consumption Behaviors
Continuing VideoNuze's pattern of highlighting relevant third-party research, today I'm pleased to make available for complimentary download a dozen research slides from Starz Entertainment. Many of you are likely familiar with Starz, which owns a leading collection of premium cable networks which have been in the forefront of pursuing broadband distribution opportunities.
Starz participated in an omnibus research study of 5,500 U.S. Internet users (4,000 18+ years-old and 1,500 12-17 years-old) in September-October '08. The survey was administered by market research firm Synovate and the goals were to measure 17 different media consumption activities on 9 different platforms.
Starz research head David Charmatz and members of his team walked me through key findings I think it will
 be beneficial for VideoNuze readers trying to make sense of the shifting video landscape. I have no financial stake in this research.
 Consistent with other numbers I've seen recently, 62% of respondents now watch some online video each week. That compares with 87% for live TV, 46% for DVD and just 38% for Time-shifted TV (DVR/VOD). There's little gender difference among those watching online video; 66% of males watch, 58% of females watch.
"Televidualists" as Starz calls them are a key group representing 18% of respondents who watch long-form media at least once per week either online, on a mobile device or through a media extender like Apple TV or Xbox. This group watched more video on all platforms and down the road I see them as the early adopters who are going to be most open to exploring online/on-demand-only solutions. To keep things in perspective, note that just 1% said that they only watch long-form content on new platforms and not on TV (and some of these may have never watched TV at all).
Importantly 60% of Televidualists are 12-34 years-old, compared to 39% overall. That's of course no surprise to anyone, and it continues to underscore how important it is for all incumbents in the existing video distribution value chain to pay close attention to serving their younger customers flexibly and cost-effectively. All of this and more data is contained in the slides.
Categories: Cable Networks
Topics: Starz
-
J.P. Morgan is Too Bearish on Online Video
There's been a lot of buzz over the last couple of days about J.P. Morgan's just-released "Nothing But Net - 2009 Internet Investment Guide," including many references to Morgan's distinctly bearish commentary on online video. I'm always interested in what other analysts are saying about video, so I downloaded the document yesterday. Though it's 340 pages, only 2 pages (81-82) are devoted to online video specifically. (And incidentally, as best I can tell, that's 2 pages more than the "Nothing But Net - 2008" devoted to the video industry.)
I have to say I found Morgan's write-up to be quite superficial, with a generally dismissive tone regarding
 online video's opportunity. Like many Wall Street analyst reports I've previously read, it seems more focused on near-term financial prospects than longer-term strategic opportunities. An investment professional without in-depth knowledge of online video trends who read the report would likely conclude that it's not worth spending much time on online video, at least in the near term. That would be a critical mistake, because, as I've said many times, online delivery is the single most disruptive influence on the video industry today.
 Morgan's analysis is strictly focused on the ad-supported model. No attention is paid to broadband's impact on the multi-billion dollar multichannel subscription TV or home video markets which companies like Netflix, Amazon, Apple and others are pursuing with disruptive fervor. As for advertising, while Morgan acknowledges that online video usage has taken off, it believes that "performance-based marketers and brand advertisers are looking at three variables in determining their investment: reach, content quality and performance measurability." In Morgan's view, today's "advertising formats do not appropriately address these three variables."
It's important to note that a key Morgan theme is that performance-based advertising models like search are more desirable than CPM-based models like display, and most video ads today. Morgan believes (and I do agree) that performance and ROI-tracking will become even more important in the down economy where ad dollars are scarce and must deliver real sales results.
Still, the reality is that over time, online video ad dollars are most likely to be shifted from TV, which is a CPM-based medium. And online video ad units offer far greater interactivity than TV ever has. But this still misses a larger point - video is a CPM-based medium because video is the pre-eminent media format to make an impression on a consumer. Nothing packs the same emotional impact as video, and that's why brands have always been drawn to TV advertising. In short, while the overall online ad market is shifting to performance, brands will always need a visual medium. With all the challenges traditional TV has (e.g. DVR-based ad skipping, audience fragmentation, etc.), online video formats that are engaging, non-skippable and interactive will gain in appeal.
Yet Morgan suggests that brand interest will remain quite muted. Paraphrasing the report, it suggests: content providers can't guarantee viewership as they can in TV (though in reality many can and have been doing so for a while now), content providers have a hard time determining pricing (though the CPM ranges for many sites has already solidified), "many video sites are plagued with videos of varying quality and copyright violations" (though outside of YouTube and MySpace, all of comScore's top 10 video sites are premium video-only) and no "ad format seems to be widely accepted by users, publishers or advertisers" (though the IAB published its digital video ad format guidelines back in May '08, and users are now well-accustomed to the kinds of ads to expect in their online video experience).
If brands' interest in online video advertising is so challenged, you wouldn't know it from actual experience. In 10 minutes of random sampling this morning here are ads I saw: Oreos (MTV.com), HP (ComedyCentral.com), Blackberry, Target (Hulu), Gillette, IBM (ESPN.com), Ritz, Sears (ABC.com) and Dunkin' Donuts, Robitussin (Yahoo). I'm not suggesting that the online video medium doesn't have its challenges in attracting brands, but based on everything I continue to hear, the premium video sites in particular - like those cited above - are holding up pretty well even in this environment. Even much-maligned user-generated video may have some unexpected silver linings; just yesterday it was reported that Japanese anime producer Kadokwa Group Holdings is pulling in $110,000/mo from its YouTube channel stocked with user-created material.
Far from being the uninteresting medium that the Morgan report depicts, online video has already become a bright spot for many established content providers whose traditional models are under pressure. It is also opening up new opportunities for new ad-supported entrants. And it is threatening to completely upend the paid part of market through improvements in "over-the-top" technologies and consumer services.
To be sure, the medium is still in its adolescence. But that's all the more reason why savvy investors, entrepreneurs and other market participants who look past cursory industry reports, and instead choose to dig in and understand the massive disruption online video is causing will do quite well in the long term.
What do you think? Post a comment now.
Categories: Advertising
Topics: J.P. Morgan
-
What Impact Does Broadband Have on TV Viewing?
Want to get your head spinning? Try making sense of the various research data that keeps spilling out about current TV consumption, and how it is being impacted by broadband video's rising popularity.
For those who think TV is largely unaffected, consider this: Last month, Nielsen reported that the average person in the U.S. watched approximately 142 hours of TV a month, which was 5 hours more than last year. Though Nielsen also said that watching video online and watching video on a mobile phone also clocked in new records at 2 hours, 31 minutes per month and 3 hours, 37 minutes per month, respectively (though, more mobile video use than online video use? That seems odd to me...).
These positive TV numbers echo what Multichannel News reported CBS research head David Poltrack recently shared: that even though 75% of TV viewers have now watched some video online, TV viewing in all demographics have gone up 8% since 2000. So maybe TV viewing isn't being hurt much.
But on the flip side is evidence that, particularly among young people, TV has already been hurt by broadband and other alternatives. Just yesterday Adweek reported upcoming numbers from Deloitte showing that viewing among 14 to 25-year-olds is now down to 10.5 hours per week, while their time spent watching video on computers continues to rise. These numbers build on research from IBM released last month that among the 76% of people they surveyed, 15% said they watched "slightly less" TV and 36% watch "significantly less" TV (note this was a 6 country study). There are other reports which have showed similar trends.
What should one conclude? My take is that broadband and other outlets are certainly having an impact among younger people, where the digital lifestyle is most pervasive. However, there are still a whole lot of people living a mainly analog lifestyle. While that provides the TV industry some short-term comfort, the long-term trends almost certainly favor less TV viewing.
What do you think? Post a comment now.
Categories: Broadcasters
-
Reviewing My 6 Predictions for 2008
Back on December 16, 2007, I offered up 6 predictions for 2008. As the year winds down, it's fair to review them and see how my crystal ball performed. But before I do, a quick editorial note: each day next week I'm going to offer one of five predictions for the broadband video market in 2009. (You may detect the predictions getting increasingly bolder...that's by design to keep you coming back!)
Now a review of my '08 predictions:
1. Advertising business model gains further momentum
I saw '08 as a year in which the broadband ad model continued growing in importance as the paid model remained in the back seat, at least for now. I think that's pretty much been borne out. We've seen countless new video-oriented sites launch in '08. To be sure many of them are now scrambling to stay afloat in the current ad-crunched environment, and there will no doubt be a shakeout among these sites in '09. However, the basic premise, that users mainly expect free video, and that this is the way to grow adoption, is mostly conventional wisdom now.
The exception on the paid front continues to be iTunes, which announced in October that it has sold 200 million TV episode downloads to date. At $1.99 apiece, that would imply iTunes TV program downloads exceed all ad-supported video sites to date. The problem of course is once you get past iTunes things fall off quickly. Other entrants like Xbox Live, Amazon and Netflix are all making progress with paid approaches, but still the market is held back by at least 3 challenges: lack of mass broadband-to-the-TV connectivity, a robust incumbent DVD model, and limited online delivery rights. That means advertising is likely to dominate again in '09.
2. Brand marketers jump on broadband bandwagon
I expected that '08 would see more brands pursue direct-to-consumer broadband-centric campaigns. Sure enough, the year brought a variety of initiatives from a diverse range of companies like Shell, Nike, Ritz-Carlton, Lifestyles Condoms, Hellman's and many others.
What I didn't foresee was the more important emphasis that many brands would place on user-generated video contests. In '08 there were such contests from Baby Ruth, Dove, McDonald's, Klondike and many others. Coming up in early '09 is Doritos' splashy $1 million UGV Super Bowl contest, certain to put even more emphasis on these contests. I see no letup in '09.
3. Beijing Summer Olympics are a broadband blowout
I was very bullish on the opportunity for the '08 Summer Games to redefine how broadband coverage can add value to live sporting events. Anyone who experienced any of the Olympics online can certainly attest to the convenience broadband enabled (especially given the huge time zone difference to the U.S.), but without sacrificing any video quality. The staggering numbers certainly attested to their popularity.
Still, some analysts were chagrined by how little revenue the Olympics likely brought in for NBC. While I'm always in favor of optimizing revenues, I tried to take the longer view as I wrote here and here. The Olympics were a breakthrough technical and operational accomplishment which exposed millions of users to broadband's benefits. For now, that's sufficient reward.
4. 2008 is the "Year of the broadband presidential election"
With the '08 election already in full swing last December (remember the heated primaries?), broadband was already making its presence known. It only continued as the year and the election drama wore on. As I recently summarized, broadband was felt in many ways in this election cycle. President-elect Obama seems committed to continuing broadband's role with his weekly YouTube updates and behind-the-scenes clips. Still, as important as video was in the election, more important was the Internet's social media capabilities being harnessed for organizing and fundraising. Obama has set a high bar for future candidates to meet.
5. WGA Strike fuels broadband video proliferation
Here's one I overstated. Last December, I thought the WGA strike would accelerate interest in broadband as an alternative to traditional outlets. While it's fair to include initiatives like Joss Wheedon's Dr. Horrible and Strike.TV as directly resulting from the strike, the reality is that I believe there was very little embrace of broadband that can be traced directly to the strike (if I'm missing something here, please correct me). To be sure, lots of talent is dipping its toes into the broadband waters, but I think that's more attributable to the larger climate of interest, not the WGA strike specifically.
6. Broadband consumption remains on computers, but HD delivery proliferates
I suggested that "99.9% of users who start the year watching broadband video on their computers will end the year no closer to watching broadband video on their TVs." My guess is that's turned out to be right. If you totaled up all the Rokus, AppleTVs, Vudus, Xbox's accessing video and other broadband-to-the-TV devices, that would equal less than .1% of the 147 million U.S. Internet users who comScore says watched video online in October.
However, there are some positive signs of progress for '09. I've been particularly bullish on Netflix's recent moves (particularly with Xbox) and expect some other good efforts coming as well. It's unlikely that '09 will end with even 5% of the addressable broadband universe watching on their TVs, but even that would be a good start.
Meanwhile, HD had a banner year. Everyone from iTunes to Hulu to Xbox to many others embraced online HD delivery. As I mentioned here, there are times when I really do catch myself saying, "it's hard to believe this level of video quality is now available online." For sure HD will be more widely embraced in '09 and quality will get even better.
OK, that's it for '08. On Monday the focus turns to what to expect in '09.
What do you think? Post a comment now.
Categories: Advertising, Aggregators, Brand Marketing, Devices, HD, Indie Video, Politics, Predictions, Sports, Technology, UGC
Topics: Amazon, Apple, AppleTV, Barack Obama, Hulu, iTunes, NBC, Netflix, Olympics, Roku, VUDU, XBox
-
Handy Digital Media Workflow Document from Marketing Mechanics
Periodically VideoNuze makes complimentary research available that is beneficial to our audience of broadband decision-makers.
Today I'm pleased to offer for complimentary download a handy one page digital media workflow
 "snapshot" created by Marketing Mechanics, a consulting and market intelligence firm run by Ellen Grace Henson. The snapshot identifies features and capabilities for over 20 broadband technology companies.
Ellen has been in and around the digital media industry for many years in product management and marketing roles and has lately consulted with Kontiki and Move Networks among others. She reached out recently to familiarize me with her work and to share the snapshot. Though she readily concedes the document is not meant to be comprehensive, it provides a very good framework for making sense of the crowded broadband landscape.
The ecosystem of companies supplying necessary products and services to content creators who want to capitalize on broadband's rise is complex and dynamic. I'm often asked for data and comparisons of industry vendors; I think the snapshot can begin to fill that role. It will no doubt evolve over time, as the industry changes and customer requirements grow.
The snapshot dates to when Ellen was consulting for Kontiki (when it was owned by VeriSign), but it was updated as of September 2008. Ellen pulled together the information by talking directly to the companies cited; by definition that means readers will need to carefully assess the data in the context of their own experience and knowledge.
Readers will also quickly notice that not all companies in the space are included; the snapshot is very much a work in process and Ellen will continue adding companies and information to it. In fact she envisions a hybrid business model where paying market intelligence subscribers would get more granular and complete competitive detail. For more information, please feel free to contact Ellen directly. Also, keep an eye on the firm's web site (where this download is also available) for future updates.
Categories: Technology
Topics: Marketing Mechanics
-
Truveo Helps Clear Video Search Fog with New Study
A couple of days ago, Truveo, the big video search engine owned by AOL, released the results of an internal study which concluded that it provides the most comprehensive search results among 5 companies considered. Before you say, "Duh, Will, what else would you have expected Truveo to conclude?!" it's worth spending a few minutes considering the study's methodology, results and implications. Video search is an extremely strategic space, so all credible data has value.
When it comes to search, there are really two key criteria to judge quality - coverage and relevancy. A search engine can return a million results, but if none are relevant, it's pointless. Conversely, just one spot-on result and you'll rejoice, but you still may yearn for additional, relevant options (since video quality can vary, links may be broken, the user experience at certain sites may stink, etc.). So optimizing both coverage and relevancy must be the goal.
In Truveo's study, it has focused solely on coverage, having deemed relevancy too subjective to credibly
 measure. To quantify coverage from a competitive standpoint, it chose 4 other search engines, Blinkx, Microsoft Live Video Search, Google Video and Yahoo Video. This limited pool immediately begs the question how the many other video search companies not included would have fared. Truveo explained that the testing was very resource-intensive, so they needed to keep the competitive set relatively small.
To measure coverage, Truveo selected 100 top-ranked Alexa sites across 5 categories: news, sports, TV, music and movies. Then they found 10 representative videos from each and ran a query for those videos - using the exact title the site used - on each of the 5 search engines. Scoring was binary - a search engine got a 1 if they returned an accurate result for at least 5 of the 10 queries, a zero if they didn't. Final score from this process, Truveo 86, Blinkx 20, Microsoft Live Video Search 17, Google Video 3, and Yahoo 2.
Having reviewed the test's full methodology and spoken to a Truveo representative, I think for the most part their approach is pretty fair. An obvious limitation is that lots of video search engines (or web search engines like Google) weren't evaluated so the study is by no means conclusive. Further, only premium sites were included (i.e. no UGC, and actually very little indie video either), so one wonders how the results would have changed if sites like Break.com, Heavy and others were also tested. And then there's the small matter of YouTube, the market's 800 pound gorilla, not being included at all. Since for many users video search begins and ends with YouTube, its omission raises a question about just how reflective these results are of real-world user behavior.
Nonetheless, Truveo gets points in my book for shedding further light on a very confusing subject, and also constructing a relatively objective methodology that can be used by others (in fact Truveo is encouraging independent 3rd parties to undertake more testing of this kind).
Video search is one of the most intellectually challenging areas of the broadband video ecosystem, yet as Truveo asserts, there is surprisingly little evaluative data out there. From my standpoint, more data means more informed market participants and therefore continually improving user experiences. That benefits everyone in the broadband ecosystem.
What do you think? Post a comment now.
(Note, the complete methodology can be requested by emailing Josh Weinberg at jweinbergATtruveo.com)
Categories: Video Search
Topics: Blinkx, Google Video, Microsoft Live Video Search, Truveo, Yahoo Video, YouTube
-
Pre-Roll Video Advertising Gets a Boost from 3 Research Studies
Pre-roll video ads' effectiveness and user acceptability is getting a boost from 3 different research studies this week. Results were released by Break/Panache and Tremor Media and by Jupiter Research, which focused on the European market. Taken together, they are an encouraging sign for the many broadband video providers who have chosen ad-supported over paid as their business model of choice.
A key highlight of all three reports concerns user acceptance and engagement with pre-roll ads. This format, whether 15 or 30 seconds, has accounted for the bulk of video ad revenues to date, and yet has been a key source of tension in the industry. Advertisers like pre-rolls because they feel like the well-understood TV model and in fact, where off-the-shelf TV ads are often just re-used (for better or worse). The downside of the interruptive pre-roll approach is that previous research has shown users hate the format. Contributing to users' feelings was the fact that many content providers have been undisciplined about implementing frequency caps or any sort of targeting (I myself have seen far too many tampon ads!).
Yet the Break/Panache results show that 78% of users viewed pre-roll ads for more than 15 seconds and the click-through rate averaged an impressive 10%. Similarly, the Tremor research showed completion rates for both 15 and 30 second ads of approximately 80%, a level it believes is reached because of its ad targeting and focusing on premium content only.
Meanwhile the story was about the same in Europe. According to Jupiter's research (as reported by AdAge), audience drop-off upon the introduction of pre-rolls is under 5%. Jupiter also makes the important point that at least 10% of users drop off after 15 seconds even when there's no ad present, simply because they're in channel surfing mode. That means some percentage of abandonment is due simply to behavior, not a specific ad type. This makes sense when you think about it.
I attribute much of these new positive results to users recalibrating their expectations about broadband video and the presence of ads. Here's what I think has happened:
Since the Internet's introduction, there's been a sense among users that "content is free." And with the exception of annoying popup ads, I think many users have learned to look past unrelated banner ads on standard web pages so they've come to perceive their whole online experience as largely "ad-free" as well. (If you don't believe me, ask yourself when you last clicked on a banner ad unrelated to your work.)
But as broadband video usage has grown, pre-roll ads that actually did interrupt the content experience felt jarring for many users. Naturally, when asked, users said, "ugh, we hate them." Fair enough. But consumers are smart, and have quickly recognized that, just like TV, to get high-quality video programming, someone has to pay, and since most users would rather that not be them, they've become more accepting of all ads, pre-rolls included. With premium sites employing some targeting now and becoming more judicious in their insertion practices (ABC.com and Hulu are great examples), users have become more accepting. Hence these positive research results.
To the extent that pre-roll business practices continue to improve, I think research will continue to show positive results. Whether you personally love pre-rolls or hate them, I see them very much here to stay.
What do you think? Post a comment.
Categories: Advertising
Topics: Break, Jupiter, Panache
-
comScore Gets Its Act Together on Ad Network Traffic Reporting
I was pleased to see comScore announce on Tuesday that beginning this month it will report two sets of numbers for online ad networks: "potential reach" and "actual reach."
Potential reach will represent the unduplicated visitors to all sites that an ad network has under contract to
 deliver ads to (based on written documentation), while actual reach will represent the number of ads actually served (based on a tagging mechanism that comScore will require the ad networks to implement to be counted). This is a welcome development, particularly in the intensely competitive video ad network space. In fact, it seems such an obvious move, one wonders why comScore has been so tardy in introducing it.
 Followers of VideoNuze and other industry blogs know that comScore's measurement deficiencies recently set off a tempest after comScore ranked YuMe, one of the large video ad networks, #8 in reach in its Ad Focus report. With YuMe trumpeting its ranking, other industry players challenged it by noting that the full audience of MSN (a site that YuMe serves ads to) had been counted. The confusion was caused by the fact that comScore had not been delineating "potential" from "actual" reach or providing apples-to-apples numbers for all networks. Chastened, comScore re-ranked YuMe, sending it plummeting in the rankings.
All of this of course only served to create more confusion for media buyers who are trying to cobble together media plans that achieve their broadband video reach and frequency goals within budget, while minimizing their time invested. Though I'm a huge advocate of the ad-supported model dominating the broadband video landscape well into the future, I'm cognizant that the friction media buyers currently encounter is the single biggest challenge the ad model currently faces in its bid to scale and redirect spending from traditional outlets.
So comScore's new reporting is a step forward after two recent steps back. Let's hope for more forward progress.
What do you think? Post a comment.
Categories: Advertising
-
comScore Revises YuMe Traffic Down
Back on July 22nd I passed on news from comScore that YuMe had broken into the top 10 ad networks, reaching almost 135 million unique visitors in June. Not so fast it turns out. As reported well by both
NewTeeVee and Online Media Daily over the few days, comScore has quietly revised YuMe's reach down to 59.2 million uniques, which would actually land it at number 32 on comScore's June Ad Focus report. The change results from re-assigning some traffic from major YuMe client MSN. comScore had given YuMe credit for all of MSN's page views, when in fact YuMe was only serving ads on certain sections of the portal. So comScore has decided it's more accurate to give YuMe credit solely for those pages.
Needless to say, YuMe is not happy about the change and is protesting the new numbers. Its argument is
 that with comScore's revised approach, YuMe traffic is being counted differently than all other ad networks. For now it continues to prominently showcase the original comScore numbers on its home page. YuMe seems determined to see a revision to the revision, so we'll all have to see what comScore does next.
 There are many posts on VideoNuze about the various ad networks and how they seek to differentiate from each other. Traffic is certainly one of the key battlegrounds, so it's no surprise this skirmish has broken out over the comScore numbers. One is tempted to feel some sympathy for media buyers...if the measurement firms haven't yet figured out how to accurately count the networks' relevant traffic, how are the agencies expected to buy on behalf of their clients?
Categories: Advertising
-
Longer-Form Live Streaming Events Get Traction
Here's another example of the multiple cross-currents in the broadband video market.
Just last week I reviewed new Magid research showing that short-form dominates broadband video consumption. Now this week I received news from Swarmcast which provides a high-quality streaming delivery platform, revealing that the average length of live streams it's serving for its customers now averages more than 75 minutes, suggesting the long-form opportunity is now firming up. An apparent contradiction? Yes. An actual contradiction? No.
What's happening is that while short-form still accounts for the vast majority of viewing instances, there are now marquee events from Swarmcast customers like MLB.com being streamed live that are generating sustained viewership. Swarmcast provides multiple examples of events that it has streamed which lead to the 75 minute average:
- July 15 - All-Star Game
- July 14 - Home Run Derby
- July 3-6 - Rothbury Music Festival
- June 28 - Nelson Mandela's 90th Birthday celebration
I think the success in live streaming events speaks to broadband's convenience. While TV is clearly the preferred viewing device, if you don't have access to one when a compelling event is on, or that content provider has chosen to stream it instead of broadcasting it, broadband is incredibly convenient.
Even so, what's traditionally held back longer-form consumption is low-quality delivery. This is the problem
 Swarmcast has focused on. I've seen examples of some of their events and the quality is impressive, even at scale. So as content providers recognize that they can indeed stream high-quality long-form events, interest will build. The next key challenge of course will be monetize these streams.
 MLB has been a poster child for succeeding with the subscription model, leveraging its loyal fan base and exclusive games. While their brand is unique, it seems like there should also be pay-per-view opportunities for high-profile live events, akin to what has worked on cable (e.g. wrestling, boxing, music, etc.). Outside of the paid model, if audiences can be built for free events, advertisers will also take interest.
Swarmcast's customers' success in longer-form live streaming is again showing that despite the current popularity of short-form, broadband is still evolving, opening up diverse opportunities for content providers.
What do you think? Post a comment.
Categories: Technology
Topics: Swarmcast
-
Broadband Video Drives Cisco's Zettabyte Forecast
Yesterday, in "Video Usage is Creating a Hairball for Broadband ISPs, Others," I scratched the surface of how ISPs' networks are becoming overwhelmed by the sheer volume of broadband video being consumed each day along with potential solutions currently under experiment.
Today, to help put the problem in some context I'm pleased to offer a dozen slides excerpted from Cisco's
recently released Visual Networking Forecast, which shows strong growth ahead for video, as it becomes the predominant type of Internet traffic. To learn more about the forecast and its implications, I recently spoke to Cisco's primary forecasting analyst, Arielle Sumits.Click here to download the slides.
Arielle explained that Cisco started doing the forecast years ago as an internal project to help inform its own business decisions. As it recognized there was a dearth of this information available publicly, it decided to release the numbers.
Cisco bases its calculations on analyst projections for Internet users, broadband connections, video subscribers, mobile connections and Internet application adoption. As a significant equipment vendor to service providers, it is also able to collect data from these customers to validate its forecast. In fact, Arielle said that in Q4 '08, Cisco will begin supplementing the forecast with actual data from 12-15 service providers, breaking down their users' consumption by video type (professional, UGC, etc.)
The forecast shows that broadband video's growth will continue apace. Cisco is forecasting half a "zettabyte" (definitions are provided) of data will cross the global Internet by 2012, with broadband video accounting for nearly 50% of the total. Accounting for video's rapid expansion, global consumer Internet traffic will quadruple by 2012.
Putting this in perspective, Cisco estimates that in 2012 global broadband video traffic will be 380 times what U.S. Internet backbone traffic was in 2000. Even in 2008, video is already impressive, with Cisco estimating that the video viewed at just 7 sites (YouTube, MySpace, Xbox Live, iTunes, NBC, ABC and Yahoo) is already greater than what U.S. Internet backbone was in 2000. (If you want to read the whole white paper Cisco wrote about the forecast, it is available here.)
While all of this is good news for those pursuing broadband video business opportunities, the forecast again underscores the significant issues facing broadband ISPs, on whom we all rely to actually deliver video across the so-called last mile. Broadband video's growth is dependent on these companies figuring out how to economically keep up with the explosion in video consumption. As I tried to point out yesterday, there are, as yet, no perfect answers to be found.
Click here to download the slides.
What do you think? Post a comment.
Categories: Broadband ISPs
Topics: Cisco
-
New Magid Survey: Short-Form Dominates Online Video Consumption and Hurts TV Viewership
Survey results being released this morning by Frank N. Magid Associates, a research consultancy, and video aggregator Metacafe provide fresh evidence that short-form video dominates online video consumption. Notably, the survey also goes a step further, finding that 28% of respondents who watch online video report watching less TV as a result.

Meanwhile though, on the same day earlier this week that I was talking to Mike Vorhaus, managing director at Magid, and Erick Hachenburg, CEO of Metacafe about this new survey, Mediaweek was reporting a separate Magid survey, commissioned by CBS, which found that "35% of the nearly 50,000 streamers surveyed...reported that they are more likely to view shows on the network as a result of having been exposed to content on the web."
As I learned from Mike, there's no actual contradiction in these 2 surveys' findings, but you do have to squint your eyes a bit to make sure you're understanding the data accurately.
 First, the findings on short-form's domination. The Metacafe survey asked respondents about the most commonly viewed types of video and presented them with category choices. The top 5 selected were all short-form oriented: Comedy/jokes/bloopers (37%), music videos (36%), videos shot and uploaded by consumers (33%), news stories (31%) and movie previews (28%). TV shows comes in at #6 (25%), followed by more short-form categories of weather, TV clips and sports clips.
 That short-form, snackable video dominates is not really a huge surprise, given YouTube's market share and the preponderance of virally shared clips. Yet Mike emphasized that short-form does not equal UGC, a point that Erick also highlights. Rather, Mike sees short-form as a legitimate alternative entertainment format that creatives are embracing and audiences are adopting. It is causing further audience fragmentation resulting in the TV audience erosion that the survey also uncovered.
Which of course begs how Magid's CBS survey data squares up. Mike explained that the key here is that the
 CBS survey is based solely on users of CBS.com. These people naturally have a greater affinity for CBS programming and their likelihood of watching CBS shows on TV will be far higher than randomly-selected audiences (such as in the Metacafe survey). Here's the CBS press release for more details.
So the CBS data suggests that networks should be encouraged that streaming their shows builds loyalty and broadcast viewership, and therefore that they should keep on doing it. Nevertheless they need to be mindful that their shows now compete in a far larger universe of video choices, and that short-form - as a new genre - is something they too should be looking to exploit. Appropriately, all the networks, and many studios, are doing exactly that.
There is no shortage of research concerning consumer media behavior floating around these days. As the two Magid surveys show, superficially data may appear to be conflicting, though in reality it is not. Observers need to make sure they're digging in, and taking away the right lessons.
What do you think? Post a comment now!
Categories: Aggregators, Broadcasters
Topics: CBS, Magid, MetaCafe, YouTube
-
YuMe Ad Network Breaks Into comScore's Ad Focus Top 10
Another sign of video advertising's continued growth is that video ad network YuMe has broken into
comScore Media Metrix's Ad Focus top 10, reaching almost 135 million unique visitors in June. The full stats are in this comScore release. While obviously a big win for YuMe (which I've previously written about here), a larger point that I think is worth noting is that this demonstrates how pervasive broadband video is becoming for all publishers. Going forward I expect YuMe's reach to continue to rise, and also for other video ad networks to keep moving up comScore's list. Categories: Advertising
-
New TDG Research Provides Details of Broadband Video Advertising's Growth
The Diffusion Group, a leading analytics and advisory firm specializing in broadband media and the digital home, is releasing a new report tomorrow entitled, "Online TV and the Future of Digital Video Advertising." VideoNuze is offering half a dozen slides as a complimentary download (note, VideoNuze has no financial interest in this report).
Though I haven't seen the full report, in a conversation with Mugs Buckley, the report's author (and also periodic VideoNuze contributor), I got a sneak peek at some of its key conclusions. The report is based on TDG's proprietary consumer research and modeling, interviews with industry executives, data from other firms and other secondary research. In sum, the report pegs '08 video ad revenue at $590 million, growing to $9.98 billion in 2013.
To establish some order, Mugs first identifies four types of video, estimating each one's current market share
 in terms of stream count and ad revenue and then forecasting them through 2013. The four types are "user generated video," "long-form," "short clips" and "other" (which includes all paid models, adult content, corporate and educational videos, etc.).
 No surprise, UGV currently accounts for 42.4% of streams, but only 3.7% of ad revenues. Conversely, long-form accounts for only 2.2% of streams but 41.6% of ad revenues. Note the disparity would be lower if, instead of using streams (where one 40 minute TV show stream is equivalent to one 10 second clip stream on YouTube), the report used "minutes viewed" or another consumption-centric metric. I agree with Mugs though - in either case, the underlying point would still be true - long-form, higher-quality video is going to be where ad dollars are and will be concentrated.
The report's forecast reinforces the point: by 2013, long-form's stream share will roughly double to 4.1%, with its share of ad revenue growing to 69.4%. Conversely UGV's stream share grows a little bit, but its ad share shrinks to 1.8% . A wildcard in this mix is the role of short-clips, defined as 2-5 minute videos including everything from news/entertainment/sports videos to webisodes. Mugs is bullish on this segment, with its lower costs to produce and ability for users to watch spontaneously. This is where a lot of market activity and original programming is happening and it's still early to gauge its acceptance by users and advertisers.
A key input to the revenue forecast is the underlying CPM forecast. Mugs said her approach was to be relatively conservative with CPM's predicting little more than inflation-adjusted growth. For long-form that means CPMs growing from $40 today to $46 in 2013, which feels pretty modest, especially if targeting and engagement tactics pay off (see more on Disney's efforts in this post). On the UGV CPM forecast, it's important to note the $15 CPM refers to YouTube's announced CPM target for partners' video, NOT pure UGV.
There's lots more info in the slides, and if you're interested in the whole report, it's best to contact sales@thediffusiongroup.com or 469-287-8050.
Categories: Advertising
Topics: The Diffusion Group
-
The Incredibly Growing YouTube
Closing out the week, I missed this blurb from Information Week yesterday reporting YouTube's staggering dominance of broadband video traffic. New numbers out from Hitwise show that in May '08 YouTube garnered 75% of the 10 million visits to 63 video sites that Hitwise is tracking. That's 9 times the traffic of #2 MySpaceTV and more than 20 times that of the #3 site which is Google's other video property (remember it?)
According to Hitwise YouTube's share rose 26% from a year ago compared with drops by all the others in the top 5 sites except Veoh, which rose by 32% from a year ago.
It's just mind-boggling to think that one site could have such market share, particularly when a lot of the
 networks' programs cannot be found there. I think it speaks to how strong users' appetites are for UGC and viral content remain, how YouTube has become a de facto video platform for lots of smaller players in the industry (and consumers) and how the company is likely beginning to enjoy some early success with its partners' channels.
 A few months ago, in "YouTube: Over-the-Top's Best Friend" I wrote that YouTube is quickly becoming the perfect ally for all those makers of new broadband-to-the-TV devices. These companies desperately need content and credible brands to help pull through consumer demand. YouTube offers both. In this sense, YouTube has huge value yet to be tapped (of course demonstrating that it can monetize its massive audience wouldn't hurt its partnership value...)
However, looked at another way, YouTube's success should be very encouraging to other players. To start with, YouTube is doing a marvelous job educating the world about the virtues of broadband video. And while YouTube is the market's 800 pound gorilla, it is still leaving key opportunities open for other players to differentiate themselves. Potential areas include high-quality delivery, ad-based and paid monetization and offering content that YouTube simply doesn't have (examples: Comedy Central programs like "The Daily Show" and "Colbert Report")
Volumes are yet to be written about YouTube. Whether it turns its market-leading traffic into a financially-explosive franchise or forever remains a red-ink spewing blip on Google's P&L is yet to be seen. Either way, when the history of broadband video is written, YouTube will be featured prominently.
Categories: Aggregators, UGC, Video Sharing
Topics: Comedy Central, Hitwise, MySpaceTV, Veoh, YouTube
-
New Strategy Analytics Research Underscores Video Consumption Shifts Among Young
I recently attended a presentation by Martin Olausson, Director of Digital Media Strategies at Strategy Analytics, who shared key findings from his firm's recently fielded digital media survey. Strategy Analytics
 is a research and consulting firm specializing in information, communications and entertainment. In a follow-up chat, Martin provided a little more color on the data and he also agreed to share a half dozen slides as a complimentary download for VideoNuze readers.
Click here to download the slides.
Some of the most interesting data confirms the shifts that are well underway in how younger people consume video. For example, the weekly TV reach for 15-19 year olds is 64%, while for 35-49 year olds it's 82%. Conversely, the weekly reach for broadband video averages around 25-26% for those in the 15-29 age brackets, but at 35-49 it drops to 15%, and then for 50+ it drops again to just 5%. Broadband consumption clearly skews younger, suggesting a more permanent shift as this group ages.
In addition, 16-18% of 15-29 year olds said they'd be interested/very interested in paying for TV online, while only 11% of those 35-49 said so, and only 3% of those 50+ said so. Similarly, 21-22% of 15-29 year olds said they'd be interested/very interested in paying for movies online, while only 16% of those 35-49 said so, and only 5% of those 50+ said so.
Media and marketing executives need to focus on what opportunities this creates. For example, this might suggest that special offers to download TV programs and movies that have particular appeal to younger people might help accelerate the paid business model. Or that co-marketing deals with other brands that already have credibility and reach into these age groups would help open up the market.
Strategy Analytics also included a revenue forecast for various business models for 2008-2012. The four paid categories, "Download to Own: Movies," "Download to Own: TV," "Download to Rent: A-La-Carte" and "Download to Rent: Subscription" total up to approximately $3.87 billion by 2012, while the ad-supported category totals to $3.48 billion by then.
Martin is most bullish on the subscription model as the big driver of paid revenues, and focuses on Netflix in particular as having a strong online delivery opportunity. While I haven't created my own revenue projections, I still bias toward thinking ad-supported will outstrip paid in the next 3-4 years. If I look longer-term, say 5-10 years out, I can see that shifting to the paid model as today's issues (portability, rights, mass broadband connectivity to TVs, etc.) are resolved at scale.
Taken together, the data adds to our understanding of what's happening in the market today and where things may be heading. If you want further information about the survey, Martin's contact information is on the cover slide.
Categories:
Topics: Strategy Analytics
-
New Statistics Address Video Piracy, Importance of Quick Online Release of TV Programs
During very informative presentations at my NAB panel discussion yesterday, there were 2 slides that really caught my attention. Both shared statistics, new to me, about video piracy and user behavior patterns. These statistics illustrate the important early online window just following when a TV program is aired. Capturing this audience spike can dampen video piracy and also be a big revenue opportunity for providers.
The first slide, shown below, was presented by Rob Adams, director of digital media operations at CTV, Canada's largest broadcaster. CTV offers both clips and full-length streaming episodes from its networks and select partner networks. In the slide below each line represents a single day's unique visitors for a specific TV series CTV offers.
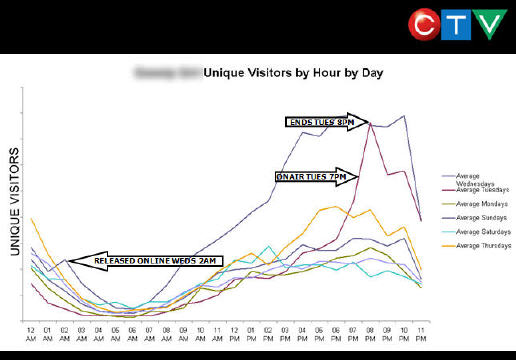
I know the slide is a bit of an eye chart, so I'll summarize the phenomenon Rob explained. In this example a popular network show airs at 7pm on Tuesday. Notice how the purple usage line spikes during the hour of its run. Rob explained that users who go online to find the episode being aired realize it's not yet available and instead begin catching up on previous episodes. That new episode is posted around 2 am, and the spike in usage the following day is shown by the blue line.
Note the far lower behavior in the other lines and it is clear that the 24 hour window during and after airing a new episode is critical. It's also interesting to speculate on whether some users are beginning to look at online availability as pure VOD. If so, that would have implications on DVRs (i.e. why record a show when you've come to expect they'll all be posted quickly online?)
The second attention-getting slide was based on recent research by Akamai and Vobile, which used its digital fingerprinting technology to track the availability of illegal copies of an episode a popular program and their download volume. In the slide below, it is clear that although illegal copies are available immediately, the volume of downloads jumps by more than 500% the following morning (13 hours after broadcast).
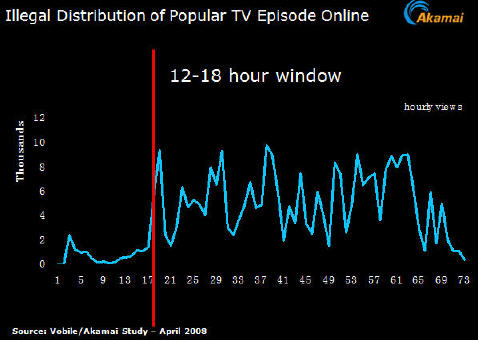
What all of this demonstrates is that there is a real window of opportunity for premium video providers to slow video piracy and drive many new video views. By satisfying the obvious demand that users have for this content with legitimate distribution, providers can chip away at, though admittedly not eradicate, illegal sharing. If users gain confidence over time that their favorite programs will be available quickly, in high-quality and with a positive user experience (i.e. not overburdened with ads), the rationale to pursue the illegal route lessens. Conversely, video providers not responding to these viewer needs continue to leave themselves highly vulnerable to illegal behavior.
Categories: Broadcasters, P2P
-
The Reality of Web Video Advertising Just Doesn't Seem to Add Up
Today's post is from TDG's Mugs Buckley, who discusses the confusing state of video advertising projections.
The Reality of Web Video Advertising Just Doesn't Seem to Add Up
by: Mugs Buckley, Contributing Analyst, The Diffusion Group
I used to think I was pretty good at math, but after trying to make sense of recent forecasts regarding web video advertising, I'm beginning to doubt my skills. Let it be known that I'm a big believer in the growth potential of the Internet video ad business; I'm simply struggling to follow the numbers that have been reported. Since no single analysis offers an "apples-to-apples" industry comparison, I thought I'd offer up some of the available forecasts and offer a few thoughts.
So here's where I'm stuck.
The estimates and forecasts for only video ads are all over the place. For example:
- eMarketer estimates that US marketers spent $775M in 2007 and will spend $1.3B in 2008 for online video streaming and in-page ads.
- Jupiter Research predicts that 2008 online video ads in the US will yield $768M.
- comScore reported that online viewers consumed 9.8B videos in January 2008 (down from December 2007's 10.1B) of which 3.4B were Google/YouTube videos.
- In a November 2007 Financial Times article, a leading media buyer for Starcom Media Group (who is well aware of her buys and rates) predicted that the 2007 market for "The Big Four" broadcast networks was likely to generate around $120M.
So here's where it gets a bit confusing.
- If we use the 3.4B monthly view Google/YouTube view estimate for January and run that out for a 12-month period, add some growth for fun, we come up with about 45B views for all of 2008.
- YouTube charges $15 CPMs for their in-video overlay ads (down from the initial $20 CPMs used during beta testing).
- If 100% of the 45B Google/YouTube videos were sold at $15 CPMs, that would yield revenue of $675M. But that assumes 100% inventory sold, which won't happen for a variety for reasons (in particular because YouTube only sells overly ads on their contracted partner deals, not user-generated content).
- According to Bear Stearns, YouTube is set to generate $22.6M in revenue for video ads, about 3.3% of the possible $675M at 100% inventory sold.
Hmmm. So if YouTube (at 34% of all web video consumed) could generate $22.6M in revenue in 2008, and the Big Four were running about $120M in 2007, how does one arrive at these impressive near-billion dollar predictions? Where else is this revenue coming from?
Let's not rule out operator error - I'll quickly admit that I may have misinterpreted how these numbers were derived and what they represent. That being said, however, there doesn't seem to be a rational way to reconcile these disparate estimates. Can anyone out there help to square these numbers? Is it simply a matter of under- or over-reporting? Are the measurement systems currently in place so poor and mutually exclusive in methodology that they necessarily offer conflicting estimates?
Something just isn't adding up. Yes, this may seem to be a bit nit-picky on my part; the rambling of an analyst with too much time on her hands. Then again, without accurate revenue and usage estimates, it is impossible to know the real value of any form of advertising, much less an emerging model such as web-based video advertising.
Please let us know what you think!
Categories: Advertising
Topics: comScore, eMarketer, Jupiter Research, The Diffusion Group, YouTube
-
What Media Planners Think of Online Video Advertising
Continuing VideoNuze's series of posts about the online video advertising industry, last week I spoke to Alistair Goodman, who's the VP of Strategic Marketing at Exponential Interactive, a media services company with hundreds of advertising clients and publishers in the digital media space.
Exponential recently released the results of a survey of 100 ad agency media planners' perceptions of online video advertising. To the best of my knowledge, the survey, "The Trials and Tribulations of Online Video
 Advertising," is the first one focused on what the people actually responsible for spending money in this new medium think (the survey is evenly split between those who have bought and those considering buying). Most prior research has focused on users' or publishers' attitudes. The research confirms many things I hear each day, and also reveals some new insights on the market.
I'm very pleased to offer a complimentary download of a subset of the Exponential's slides exclusively here at VideoNuze. If your business is reliant on video advertising, I highly suggest reviewing them. If you have questions or want to receive the full deck, there is contact info on the last slide.
The top 2 issues for planners who have actually bought video ads are operationally-oriented: "smooth delivery" and "detailed reporting." As Alistair described it, these factors (and others cited) confirm the complexity of executing a campaign at scale. The complexity results from lack of standards, multiple players/formats, fragmentation of viewership and non-standard metrics. None of this is unexpected in a market as nascent as online video; the challenge is addressing and resolving these quickly for online video to reach its full potential.
In the past I've mentioned repeatedly that monetization is the number 1 priority for both established and early stage video content providers. This is an urgent issue because lots of energy and money is being invested in creating online video content, but the financial returns are not there yet. These payoffs need to materialize if the enthusiasm around this new medium is to be sustained.
Click here to download the Exponential slides.
(Note: I have created a new section in VideoNuze to offer all downloads of all relevant market research. If you have complimentary industry data please contact me and I'll add it to the page.)
Categories: Advertising
Topics: Exponential Interactive, Tribal Fusion
Posts for 'Research'

Connect with VideoNuze
Exclusive News Roundup
- As Netflix Tries to Reset Narrative for Investors, Live Programming Could Play ‘Starring Role’ Variety
- Paramount+ Subscribers Fail to Block Warner Bros. Merger as States Will Try Again Friday Variety
- How Amazon Is Turning the BookTok Boom Into Hit TV WSJ
- Fandango to Be Overhauled In Bid to Rival Free Streamers Like Tubi and Pluto The Hollywood Reporter
- Paramount, WBD hit with lawsuit from 12 states, including California, to block merger CNBC
- Hollywood’s Horror-Meme Gold Rush Is Minting Millionaires WSJ

