-
New comScore Research Available: More Ads Tolerable in Online TV Programs
An article I read last week in Mediaweek about new comScore research which concluded more ads are tolerable in online-delivered TV programs really intrigued me. The research was presented by Tania Yuki, comScore's director of cross media and video products at an Advertising Research Foundation meeting. I called Tania to follow up and learn more about the data. Today I'm pleased to share her presentation with the research findings as a complimentary PDF download. Outside of the ARF meeting, this is the first time this data has been made available.
Click here to download the research presentation
As VideoNuze readers know, I've been a proponent of increasing the number of ads in online TV shows, in order to improve their economics. Note, I'm not advocating a jump to 18-20 minutes of ads typically found in on-air distribution that would likely turn users off. But I do believe that the current model of 3-4 minutes of ads in premium network programs is way too light, and that viewers will tolerate more without any drop-off in usage, particularly if the ads are well-targeted and engaging. ABC has told me in the past that research it conducted when it experimented with doubling its ad load corroborated this point, just as the comScore research now does as well. Just last week the CW announced it would double the number of ads in its online-delivered programs.
Increasing the number of ads - and thereby strengthening the economic model for online-delivered TV - is critical for the industry to succeed long-term. The current lack of economic parity between online and on-air is gaining urgency; just last week when Hulu blocked access to its content via the new Kylo browser (meant for on-TV browsing), we were reminded of the absurd lengths to which the popular site will go to prevent its viewership from migrating to TVs. This is because Hulu was conceived as an online-only augment. Given its lack of economic parity with on-air (or with DVR viewing, as ABC.com is now achieving), Hulu on TV would undermine its owners' P&Ls.
The new comScore research concludes that viewers will tolerate 6-7 minutes of "total advertising time" during online-delivered TV programs. And note that this response reflects expectations of conventional advertising. I think it's quite possible that if respondents had been shown the kinds of targeted, entertaining and interactive video ads that blip.TV and others are now offering, they would have said their tolerance would be even higher. Providing further comfort that more ads are reasonable, when asked about the most important reasons for watching TV online, the answers were first, "Missed an episode on TV" (71%) and second, "Convenience" (57%). A distant third was "Less ads" (38%). Ad avoidance is important to online viewers, but it isn't their sole motivator.
The comScore research further underscores the growing importance of online, particularly in terms of raising programs' visibility and sampling. For example, for people who watch both on TV and online, an "online video site" (28%) is already the third most-cited way of discovering new TV shows, following "TV advertising" (59%) and "Friend/family member recommendation" (44%). Related, 28% said that they believed that if they hadn't been made aware of their favorite program online first, they probably wouldn't have discovered it on TV, and therefore would have missed the show entirely. Across all respondents, 20% of shows watched regularly had been watched first online.
As Tania reminded me, TV is still by far the dominant platform for viewing TV programs and that it's important to remember that online-only viewing is nascent. ComScore's research found that only 6% of respondents tune-in online only, though another 29% view both online and on-air. The key for me is looking toward the future. When the 6% of online-only viewers is broken down by age groups, about 75% are between 18-34. And if my 8 and 10-year old kids are any example, no doubt that those under 18 are only going to be even more avid online video viewers. In order for the TV industry to succeed in the future, it is essential that the business models to sustain online viewing be figured out pronto.
For this research, comScore which surveyed 1,825 people from its U.S.-only panel, weighted to match the total online population in age, income and gender. The research was conducted between Dec. 30, 2009 and Jan. 22, 2010. It was not sponsored by any third-party.
A reminder that if you're keen on this topic, join us for the complimentary April 8th webinar, "Demystifying Free vs. Paid Online Video" and then at the April 26th VideoSchmooze in NYC, where our panel topic is "Money Talks: Is Online Video Shifting toe the Paid Model?" (early bird tickets now available).
What do you think? Post a comment now (no sign-in required).
Categories: Advertising, Broadcasters
-
Interpreting comScore's January 2010 Online Video Usage Decline
comScore released its Jan '10 online video rankings yesterday, and while the numbers were still very strong, they did show declines from Dec '09. For example, in Jan, total monthly views were 32.4 billion, compared with 33.2 billion in Dec '09, a decline of 2.4%. To try to put this blip downward in a little more context see the chart below. I've called out the Dec-Feb period for the past 3 years. In prior years there have been slight to moderate decreases somewhere in this period. This might suggest some seasonality, based on limited historical data.
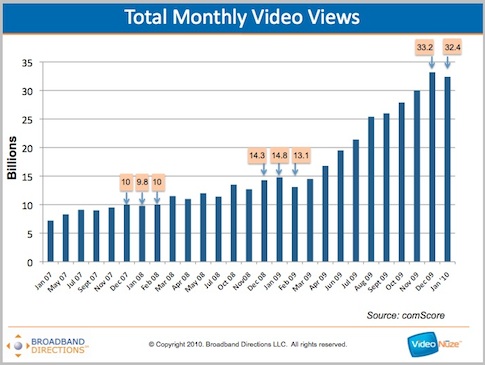
It's also worth noting that over the course of the last 3 years there have been 7 monthly sequential declines in the total monthly video views. Obviously nothing grows uninterrupted forever, and nobody should expect this from the online video market. Still, when you look at the overall growth curve, there can't be too many other Internet activities that have grown as consistently, with the exceptions maybe of social media (e.g. Twitter, Facebook, etc.).
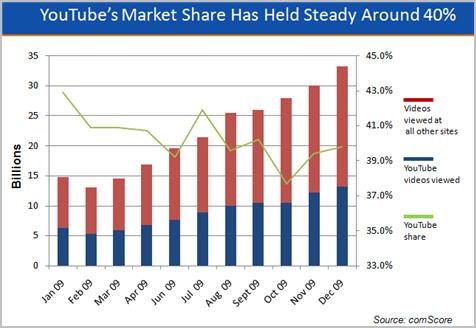
Elsewhere in the comScore stats, YouTube remained the undisputed 800 pound gorilla for another month, once again maintaining its approximate 40% market share (39.4% in Jan to be exact). According to comScore, YouTube's market share hasn't been below 35% since May '08, when total video views were 12 billion. In other words, even as total views have almost tripled, YouTube has consistently held onto its market share. Pretty amazing.
Hulu also had another strong month, notching 903 million views (its 3rd best month) from 38.4 million unique visitors. Still, the unique visitor count tumbled by 13% from 44.2 million in Dec '09 to 38.4 million in Jan (by comparison YouTube increased from 135.8 million unique visitors in Dec to 136.5 million in Jan). As I mentioned recently, I'm looking for evidence that Hulu can expand its U.S. user base beyond the 35-45 million range it's been in for over a year.
One other point worth noting from the Jan data is that Vevo, the music video aggregation site just launched in Dec '09 broke into the top 10 with 32.3 million unique viewers and 226.1 videos viewed. Vevo's rapid growth is further testament to the popularity of music videos online and the continued importance of short-form.
What do you think? Post a comment now (no sign-in required).
Categories:
Topics: comScore, Hulu, VEVO, YouTube
-
Why Did Online Video Consumption Spike in 2009?
If you want to get a sense of how significant an inflection year 2009 was for online video, have a look at the chart below.
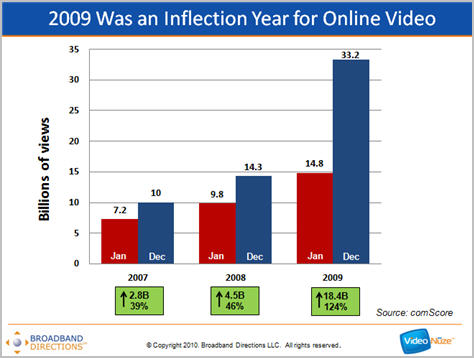
As you can see, according to comScore data, while Jan-Dec growth in 2007 (up 2.8 billion views or 39%) and 2008 (up 4.5 billion views or 46%) were impressive by any standard, the Jan-Dec 2009 growth of 18.4 billion views, up 124%, completely blows them away. Growth was so significant in 2009 that I think years down the road it will be pointed to as the year that online video really turned the corner.
But if that's the case, the question begs, "Why did growth accelerate so much in 2009 vs. prior years?" That's what I've been asked several times by industry colleagues since posting "comScore Data Shows 2009 Was a Blistering Year for Online Video" 2 weeks ago. It's a great question and though I don't have a really precise answer, here's my best sense of what happened.
No surprise, the most important contributor to the year's growth was YouTube. It zoomed from 6.3 billion views in Jan '09 to 13.2 billion in Dec. '09. That increase of 6.9 views accounts for 38% of the 18.4 billion delta between Jan and Dec. So what did YouTube do to generate such significant growth? Part of the reason is surely organic; more people uploading, sharing and viewing YouTube videos. But in 2009 YouTube also made strides in professionalizing the content on YouTube, broadening its value proposition to users. For example, its "Content ID" program, which lets media companies manage and monetize user-uploaded videos, has largely addressed the copyright infringement concerns from past years (the Viacom suit is a notable exception).
In 2009, among other things, YouTube also signed up Disney/ESPN, Univision and others as content partners, began implementing FreeWheel's ad system so 3rd party content providers could better monetize their views, engaged a number of leading brands to use it as a promotional platform, and with "YouTube Direct" engaged news organizations as partners. In short, YouTube continues to immerse itself into the fabric of the Internet. Whether users are viewing videos at its site or through its wildly popular embeds, YouTube has become omnipresent. YouTube now also claims to be the 2nd largest search site.
A second, but distant contributor to 2009's growth was Hulu, which saw its views increase by over 763 million from Jan to Dec, accounting for about 4% of the 18.4 billion increase in total views during that period. Hulu's mindshare leaped following its 2009 "Evil Plot" Super Bowl ad featuring Alec Baldwin and the subsequent ones. No doubt the addition of ABC programs throughout the year, plus other new content partners, also helped generate more viewership, along with the hugely popular SNL clips.
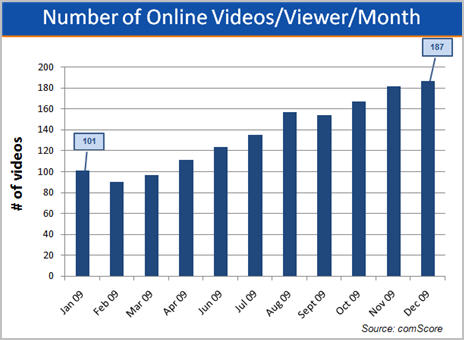
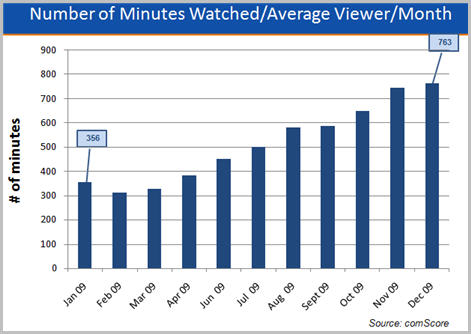
Once you get beyond these top 2 sites, the individual contributions to 2009's growth are more dispersed. The comScore data shows that across all video sites, usage intensified significantly during the year. For example, the number of videos viewed per viewer increased from 101 in Jan to 187 in Dec. The number of minutes watched jumped from 356 in Jan (almost 6 hours) to 762 in Dec (more than 12 1/2). There were also 31 million more U.S. Internet users watching video in Dec vs. Jan (178 million vs 147 million).
Looking beyond the numbers and thinking more qualitatively, it's also fair to conclude than in '09 online video reached a certain level of awareness that made it almost ubiquitous. There is just so much video online, and it is shared so widely, and highlighted so frequently by mainstream media, that it is unavoidable, even for the least technically-savvy among us. People are increasingly entertaining themselves with online video, but they're also finding new uses for it in their daily personal and professional lives.
I think it's unlikely we'll see the same level of growth in 2010 as in 2009, but I do believe the growth curve over the next 5 years will be very steep. The primary contributor will be convergence devices (e.g. game consoles, Blu-ray players, Roku, etc.) that are bridging online video to the TV where longer-form consumption will be the norm. Another key contributor will be TV Everywhere services, which are just now getting off the starting blocks. Lastly, I think growth in mobile consumption will be another important contributor. Add them all up and the 33.2 billion videos viewed in Dec. '09 will look relatively small 5 years from now.
What do you think? Post a comment now (no sign-in required).
Categories: Aggregators
Topics: comScore, Hulu, YouTube
-
VideoNuze Report Podcast #49 - February 12, 2010
Daisy Whitney and I are pleased to present the 49th edition of the VideoNuze Report podcast, for February 12, 2010.
This week Daisy and I dig into the 2009 comScore data that I detailed in my post on Tuesday (slides available for download too). It was a blistering year for online video, with total streams growing from 14.8 billion in Jan '09 to 33.2 billion in Dec '09. All the other relevant metrics also recorded strong growth. I share more details on the numbers and what they mean, focusing particularly on the top 2 sites YouTube and Hulu.
Then Daisy discusses her takeaways from the recent iMedia conference she helped organize. She talks about how brands are trying to break through the clutter, and the role of online video ad networks. Finally, she also discusses recent interviews she conducted with Facebook executives.
Click here to listen to the podcast (13 minutes, 55 seconds)
Click here for previous podcasts
The VideoNuze Report is available in iTunes...subscribe today!
Categories: Advertising, Podcasts
Topics: comScore, Hulu, iMedia, YouTube
-
comScore Data Shows 2009 Was a Blistering Year for Online Video (Slides Available)
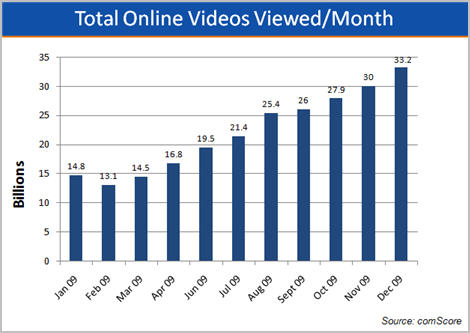
Last Friday, comScore released its Dec. '09 data for online video usage. I've been tracking comScore's data for the last 3 years and Dec put an exclamation mark on what many of us already knew: 2009 was a blistering year of growth in online video consumption. Below are graphs of the most important data (Click here if you'd like a complimentary PDF download of all of the slides.)
The first graph shows total online video views more than doubled from 14.8 billion in Jan '09 to 33.2 billion in Dec '09. The historical growth is even more impressive. Just two years ago, in Dec '07, comScore reported 10 billion video views.
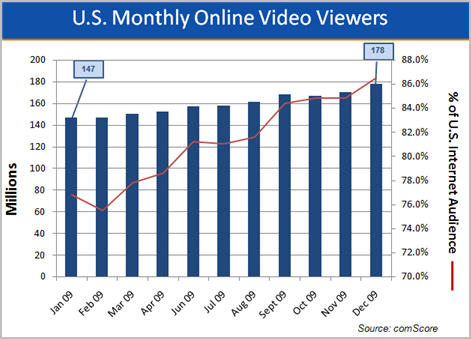
Online video usage is now nearly ubiquitous in the U.S. According to comScore, in Dec '09, 86.5% of all U.S. Internet users watched online video, up nearly 10 percentage points from the 76.8% in Jan '09. That translates to 178 million people watching video in Dec '09, up from 147 million in Jan '09. Back in Jan '07, there were 123 million viewers.
Those users are watching a whole lot more videos as well. For Dec '09, comScore reported that 187 videos were watched per average viewer, up 85% from 101 in Jan '09, and more than triple the 59 watched in Jan '07.
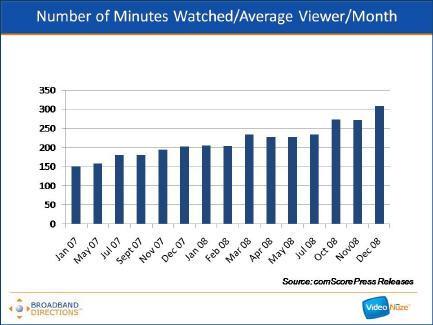
As well, those viewers spent a lot more time watching online video. In Dec '09 comScore said that the average online viewer watched 762.6 minutes or 12.7 hours, more than double the 356 minutes viewed on average in Jan '09. Here's the really incredible stat: back in Jan '07, comScore pegged this number at just 151 minutes or about 2 1/2 hours, meaning average viewing time has more than quintupled in the last 3 years.
I've talked many times about how YouTube is the 800 pound gorilla of the online video market, and 2009 only further cemented this. Videos viewed at YouTube surged from 6.3 billion in Jan '09 to 13.2 billion in Dec '09. To put this in perspective, Google closed its acquisition in Nov '06. In Jan '07 (the first month comScore publicly released online video data), YouTube notched 1.2 billion views. That means that in the 3+ years that Google has owned YouTube, it has grown more than 10x in size. More amazing is that even with all the growth by other sites (particularly Hulu), YouTube has kept up its approximate 40% share of the overall online video market, starting the year at 42.9% and ending at 39.8%.
Speaking of Hulu, in its first full year of operation, the site surged from 250 million views in Jan '09 to 1,013 billion views in Dec '09. Unique viewers increased from 24.4 million in Jan '09 to 44.1 million in Dec '09. But if you look at the red line in the graph below, you'll see that uniques jumped to 41.6 million by Mar '09 which I believe must be due, at least in part, to a likely measurement change by comScore. Since Mar you'll notice that uniques hovered right around 40 million each month, dipping below during the summer and then bouncing back in Q4.
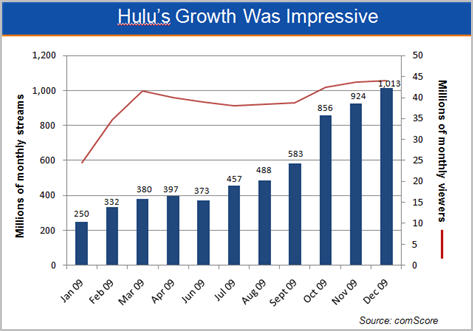
A few months ago I speculated that Hulu's relatively flat pattern in uniques could suggest that, in its current configuration, Hulu may have saturated the market for its content and user experience (for example, contrast Hulu with YouTube, which grew its uniques by 33% in '09 to 135.8 million by Dec '09). I'll be looking to see if Hulu can notch more noteworthy increases in uniques during '10; if not, then I think my thesis will be proven correct.
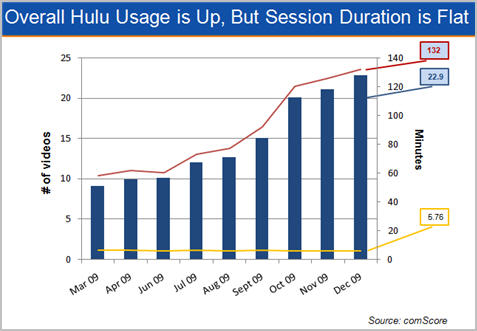
Nonetheless, Hulu's viewers clearly love the site, with average number of videos per viewer more than doubling to 22.9 in Dec '09, up from 9.8 in Dec '08. Users are spending more time on Hulu, increasing the amount of total minutes on the site from 58 in Mar '09 to 132 in Dec '09. What's remarkable though is that the average minutes watched per video (the yellow line below), has stayed virtually constant at around 6 minutes each month. That shows that while there's plenty of long-form consumption happening at Hulu, clips are still very popular too.
comScore is a great source of month in and month out online video data, but as always my caveat is that no third party can ever track usage as closely as the sites themselves, so take these numbers with a small grain of salt!
Click here if you'd like a complimentary PDF download of all of the slides.
What do you think? Post a comment now (no sign-in required).
Categories: Aggregators
Topics: comScore, Hulu, YouTube
-
4 Items Worth Noting for the Jan 4th Week (Netflix-WB Continued, comScore Nov. '09 stats, TV Everywhere, 3D at CES)
Following are 4 items worth noting for the Jan 4th week:
1. TechCrunch disagrees with my Netflix-Warner Bros. deal analysis - In "Netflix Stabs Us In The Heart So Hollywood Can Drink Our Blood," (great title btw) MG Siegler at the influential blog TechCrunch excerpts part of my post from yesterday, and takes the consumer's point of view, decrying the new 28 day "DVD window" that Netflix has agreed to in its Warner Bros deal. Siegler's main objection is that "Hollywood thinks that with this new 28-day DVD window deal, the masses are going to rush out and buy DVDs in droves again." Instead, Siegler believes the deal hurts consumers and is going to touch off new, widespread piracy.
I think Siegler is wrong on both counts, and many of TechCrunch's readers commenting on the post do as well. First, nobody in Hollywood believes DVD sales are going to spike because of deals like this. However, they do believe that any little bit that can be done to preserve the appeal of DVD's initial sale window can only help DVD sales which are critical to Hollywood's economics. Everyone knows DVD is a dying business; the new window is intended to help it die more gracefully. And because new releases are not that critical to many Netflix users anyway, Netflix has in reality given up little, but presumably gotten a lot, with improved access for streaming and lower DVD purchase prices.
The argument about new, widespread piracy by Netflix users is specious. With or without the 28 day window, there will always be some people who don't respect copyright and think stealing is acceptable. But Netflix isn't running its business with pirates as their top priority. With 11 million subscribers and growing, Netflix is a mainstream-oriented business, and the vast majority of its users are not going to pirate movies - both because they don't know how to (and don't want to learn) and because they think it's wrong. Netflix knows this and is making a calculated long-term bet (correctly in my opinion) that enhancing its streaming catalog is priority #1.
2. comScore's November numbers show continued video growth - Not to be overlooked in all the CES-related news this week was comScore's report of November '09 online video usage, which set new records. Key highlights: total video viewed were almost 31 billion (double Jan '09's total of 14.8 billion), number of videos viewed/average viewer was 182 (up 80% from Jan '09's 101) and minutes watched/mo were approximately 740 (more than double Jan '09's total of 356).
Notably, with 12.2 billion views, YouTube's Nov '09 market share of 39.4% grew vs. its October share of 37.7%. As I've previously pointed out, YouTube has demonstrated amazingly consistent market dominance, with its share hovering around 40% since March '08. Hulu also notched another record month, with 924 million streams, putting it in 2nd place (albeit distantly) to YouTube. Still, Hulu had a blowout year, nearly quadrupling its viewership (up from Jan '09's 250 million views). But with 44 million visitors, Hulu's traffic was pretty close to March '09's 41.6 million. In '10 I'm looking to see what Hulu's going to do to break out of the 40-45 million users/mo band it was in for much of '09.
3. Consumer groups protest TV Everywhere, but their arguments ring hollow - I was intrigued by a joint letter that 4 consumer advocacy groups sent to the Justice Department on Monday, urging it to investigate "potentially unlawful conduct by MVPDs (Multichannel Video Programming Distributors) offering TV Everywhere services." The letter asserts that MVPDs may have colluded in violation of antitrust laws.
I'm not a lawyer and so I'm in no position to judge whether any actions alleged to have taken place by MVPDs violated any antitrust laws. Regardless though, the letter from these groups demonstrates that they are missing a fundamental benefit of TV Everywhere - to provide online access to cable TV programming that has not been available to date because there hasn't been an economical model for doing so. In the eyes of people who think that making money is evil, the TV Everywhere model of requiring consumers to first subscribe to a multichannel video service seems anti-consumer and anti-competitive. But to people trying to make a living creating quality TV programming, the preservation of a highly functional business model is essential.
These advocacy groups need to remember that consumers have a choice; if they don't value cable's programming enough to pay for it, then they can instead just watch free broadcast programs.
4. 3D is the rage at CES - I'll be doing a CES recap on Monday, but one of the key themes of the show has been 3D. There were two big announcements of new 3D channels, from ESPN and Discovery/Sony/IMAX. LG, Panasonic, Samsung and Sony announced new 3D TVs. And DirecTV announced that it would launch 3 new 3D channels by June 2010, with Panasonic as the presenting sponsor. 3D sets will be an expensive proposition for consumers for some time, but prices will of course come down over time.
Something that I wonder about is what impact will 3D have on online and mobile video? Will this spur innovation in computer monitors so that the 3D experience can be experienced online as well? And how about mobile - will we soon be slipping on 3D glasses while looking at our iPhones and Android phones? It may seem like a ridiculous idea, but it's not out of the realm of possibility.
Enjoy your weekend!
Categories: 3D, Aggregators, Broadcasters, Cable Networks, Cable TV Operators, FIlms, Studios
Topics: 3D, comScore, Netflix, TV Everywhere, Warner Bros.
-
Parsing Hulu's 856 Million Streams Yields Valuable Insights
Just before the Thanksgiving buzzer went off for many last Wednesday, comScore released its October 2009 Video Metrix data under the banner headline "Hulu Delivers Record 856 Million U.S. Video Views in October During Height of Fall TV Season." Hulu's 856 million views (which are 47% higher than its September total of 583 million) are indeed eye-grabbing. When viewed in the context of Hulu's performance to date, as tracked by comScore since May, 2008 shortly after the site's launch, it's possible to glean a number of valuable insights.
Below is a chart with comScore's data for Hulu's total monthly video views and unique visitors since May '08. The blue bars would make any online content CEO swoon; in the 18 months since it launched, Hulu has increased its monthly views nearly 10-fold, from 88.2 million in May '08 to this past October's 856 million.
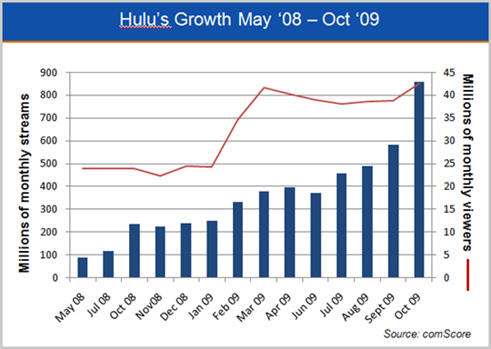
Two clear viewership spikes are noticeable - from July '08 to Oct '08 there was a 97% increase in views (from 119.3 million to 235 million) and from July '09 to Oct '09 there was an 87% increase (from 457 million to 856 million). It should be noted that the Nov '08 total of 226.5 million was down nearly 4% vs. Oct '08, potentially foreshadowing a decrease to come in Nov '09 as well. Other than this dip, there has been only 1 other sequential monthly drop in Hulu's views, a 6% drop from April '09 to June '09. Taken together, Hulu's steady, yet dramatic increase in viewership is remarkable.
On the other hand, I believe the red line in the chart, showing unique monthly visitors, raises some concerns. You'll notice that after a solid 20% jump in uniques from Feb '09 (34.7 million) to March '09 (41.6 million), unique visitors have stayed in a fairly level range through Oct '09 (42.5 million), with uniques actually below the 40 million mark for Jun-Sept. This contributes to a theory I've been developing about Hulu for some time now: in its current configuration, I think it's quite possible that Hulu has saturated the market for its content and user experience. This isn't a hard-and-fast conclusion, but it's worth noting that even with the addition of the ABC programs, Hulu's uniques are scarcely better than they were 6 months ago. Unless the unique number jumps in the coming months (and I doubt it will), Hulu will have to meaningfully enhance its value proposition to grow its audience (can you say "Hulu-to-the-TV-via-Xbox/Roku/Apple TV/etc?").
As the blue bars in the chart below show, usage of Hulu by its users is growing nicely. According to comScore, the average Hulu viewer viewed 20.1 videos on the site in October, up 33% from September's 15.1 videos, and nearly double July's 10.1 videos. In October Hulu drove almost double the number of videos/viewer as the Microsoft (11.1 videos) and Viacom (10.3 videos) sites, though it still lags the Google sites, which are primarily YouTube (83.5 videos) by an enormous margin. As I've said many times, YouTube is the month-in-and-month-out 800 pound gorilla of the online video market.
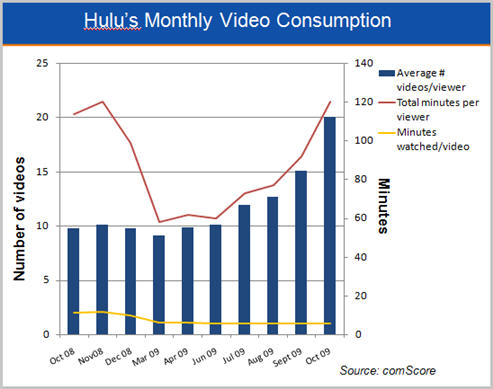
As shown by the red line in the chart, the 120 total minutes viewed per Hulu viewer is roughly even with Nov '08. However, it's possible that comScore was measuring this differently a year ago, as Hulu's minutes per viewer drop dramatically and oddly, from Nov '08 to Mar 09 (58 minutes). Since that time though Hulu's minutes per viewer have steadily increased.
That said, as the yellow line shows, the minutes watched per video have stayed remarkably constant, hovering in a very narrow range around 6 minutes since Mar '09. Hulu's users are spending more time on the site watching more total videos, but it seems they watch a very consistent mix of short clips and longer programs each month. In fact, while Hulu is commonly thought of as a site for full-length TV programs, only 1 of its top 10 most popular videos of all time is a full program and not a short clip, and only 6 out of its top 20 videos are full programs (though the mix may be changing as this month 8 out of the top 10 and 16 out of the top 20 most popular are full programs). To the extent that Hulu viewers stick with a program to its end, the current month's usage would suggest that minutes watched per video is poised to increase, along with it revenue per user session, which is an important barometer of the site's success.
With its exclusive access to 3 of the 4 broadcast networks' hit programs, Hulu has significant competitive advantages, which it has further capitalized on with its superb user experience. Despite positive and encouraging reports about its ad sales efforts, Hulu still has a long way to go to prove it can monetize its audience as effectively as its parent companies can do with programs viewed on-air. As a result speculation about a Hulu subscription service (which I consider inevitable) will continue to loom.
Other variables affecting Hulu's future also swirl: what will Comcast do if/when it acquires NBCU and therefore becomes a Hulu owner? What happens to Fox's programs on Hulu should Rupert Murdoch expand his focus beyond his newspapers' online content going premium? What if Disney decides to launch its own subscription services? What if Google or Microsoft or Netflix (or someone else) decides to open their wallet and make a bigger play in premium online video?
Hulu is still a relatively young site and the insights above are not fully conclusive, especially because they're based on 3rd party data. Hulu has clearly built a solid brand and user experience. Its monthly performance is well worth following.
What do you think? Post a comment now.
Categories: Aggregators
-
First Look At comScore's September Video Rankings Show Tremor Media Gains
According to comScore's September Video Metrix report reflecting actual unique viewers, Tremor Media is the top-ranked video ad network, with 33.6 million unique viewers, followed by BBE with 27.4 million and BrightRoll with 25.1 million.
comScore has not yet released it monthly top 10 results, but a sneak peek shows that Tremor places #8 on the list (I believe the first time an ad network has cracked the top 10), Jambo Media, a video syndicator (and also a VideoNuze sponsor) comes in at #9 with 32.3 million viewers and Facebook shows up at #10 with 31.1 million. All 3 companies are new to comScore's top 10 and compared to comScore's August top 10 list, they replace Turner (now #12), AOL (now #15) and Disney (now #20). All 7 other top 10 sites are back, though with a little shuffling (Google/YouTube, Fox, Yahoo, CBS, Viacom, Microsoft and Hulu).
With respect to the video ad networks specifically, as I've written previously, there's an ongoing debate about which numbers are most relevant to focus on. comScore has been working to fully populate its actuals
list, which requires cooperation from the video ad networks themselves. Another way of measuring video ad networks' size is by "potential reach," which considers the total number of viewers of all the sites in a network (so for an ad network that would mean all sites it has the right to place ads on). Looking at both provides a broader picture of video ad networks' size.By the potential reach measure, among video ad networks, Tremor is the top-ranked, with 72.9 million unique viewers, YuMe is #2 with 66.2 million, Ad.com is #3 with 57 million, SpotXchange is #4 with 55.7 million, ScanScout is #5 with 54.9 million and BrightRoll is #6 with 51.4 million. Oddly missing from the potential reach list is BBE, which in August was the fourth-largest video ad network with 62.7 million unique viewers. I'm trying to get an answer to that one. Tremor also announced yesterday that 60 sites have recently joined its publisher network, including A&E, Hachette Filippachi US, Thompson Reuters and SBTV.
It's also worth mentioning that Google/YouTube continues to dominate the video landscape. In September it is up to 10.4 billion videos viewed (vs. 10 billion in August), with a 40.2% market share (vs. 39.6%) in August. As the comScore data compilation slides I offered on August 31st support, Google/YouTube's share has hovered consistently around 40% since the middle of 2008.
Data like the above is obviously extremely important for understanding the evolving online video landscape. I'm cognizant of many people's concerns that the comScore data is incomplete or does not synch with internal logs or other measurement techniques. However, comScore is the only third-party data source that consistently releases results, providing trend data to analyze. Although I wouldn't suggest "taking the data to the bank," I do believe comScore provides great directional evidence of the market's growth and the standing of individual players.
What do you think? Post a comment now.
Categories: Advertising
Topics: comScore, Tremor Media
-
4 Items Worth Noting (comScore, Viral videos' formula, Netflix, VideoSchmooze) for Sept 26th Week
Following are 4 news items worth noting from the week of Sept. 26th:
1. Summer '09 was a blockbuster for online video - comScore released U.S. online video viewership data early this week, providing evidence of how big a blockbuster the summer months were for each metric comScore tracks. The 3 metrics that I watch most closely each month showed the healthiest gains vs. April, the last pre-summer month comScore reported. Total videos viewed in August were 25.4 billion, a 51% increase over April's 16.8 billion. The average number of videos watched per viewer was 157, up 41% from April's 111. And the average online video viewer watched 582 minutes (9.7 hours), a 51% increase from April's 385 (6.4 hours).
Also worth noting was YouTube crossing the 10 billion videos viewed in a single month mark for the first time, maintaining a 39.6% share of the market. According to comScore's stats I've collected, YouTube has been in the 39% to 44% market share range since May '08, having increased from 16.2% in Jan '07 when comScore first started reporting. Hulu also notched a winning month. While its unique viewers fell slightly to 38.5M from 40.1M in April, its total video views increased from 396M to 488.2M, with its average viewer watching 12.7 videos for a total of 1 hour and 17 minutes. It will be very interesting to see if September's numbers hold these trends or dip back to pre-summer levels.
2. So this is how to make funny viral branded videos - I was intrigued by a piece in ClickZ this week, "There's a Serious Business Behind Funny Viral Videos" which provided three points of view - from CollegeHumor.com, The Onion and Mekanism (a S.F.-based creative production agency) - about how to make branded content funny and then how to make it go viral. The article points out that a whole new sub-specialty has emerged to service brands looking to get noticed online with their own humorous content.
Humor works so well because the time to hook someone into a video is no more than 2-3 seconds according to Mekanism's Tommy Means. Beyond humor, successful videos most often include stunts or cool special effects or shock value. Once produced the real trick is leveraging the right distribution network to drive viral reach. For example, Means describes a network of 100 influencers with YouTube channels who can make a video stand out. After reading the article you get the impression that there's nothing random about which funny videos get circulated; there's a lot of strategy and discipline involved behind the scenes.
3. Wired magazine's article on Netflix is too optimistic - I've had several people forward me a link to Wired magazine's article, "Netflix Everywhere: Sorry Cable You're History" in which author Daniel Roth makes the case that by Netflix embedding its streaming video software in multiple consumer electronics devices, the company has laid the groundwork for a rash of cable cord-cutting by consumers.
I've been bullish for sometime on Netflix's potential as an "over-the-top" video alternative. But despite all of Netflix's great progress, particularly on the device side, its Achilles' heel remains content selection for its Watch Instantly streaming feature (as an example, my wife and I have repeatedly tried to find appealing recent movies to stream, but still often end up settling for classic, but older movies like "The English Patient").
Roth touches on this conundrum too, but in my opinion takes a far too optimistic point of view about what a deal like the one Netflix did with Starz will do to eventually give Netflix access to Hollywood's biggest and most current hits. The Hollywood windowing system is so rigid and well-protected that I've long-since concluded the only way Netflix is going to crack the system is by being willing to write big checks to Hollywood, a move that Netflix CEO is unlikely to make. The impending launch of TV Everywhere is going to create whole new issues for budding OTT players.
Although I'm a big Netflix fan, and in fact just ordered another Roku, I'm challenged to understand how Netflix is going to solve its content selection dilemma. This is one of the topics we'll discuss at VideoNuze's CTAM Summit breakfast on Oct. 26th in Denver, which includes Roku's VP of Consumer Products Tim Twerdahl.
4. VideoSchmooze is just 1 1/2 weeks away - Time is running out to register for the "VideoSchmooze" Broadband Video Leadership Evening, coming up on Tues, Oct 13th from 6-9pm at the Hudson Theater in NYC. We have an amazing discussion panel I'll be moderating with Dina Kaplan (blip.tv), George Kliavkoff (Hearst), Perkins Miller (NBC Sports) and Matt Strauss (Comcast). We'll be digging into all the hottest broadband and mobile video questions, with plenty of time for audience Q&A.

Following the panel we'll have cocktails and networking with industry colleagues you'll want to meet. Registration is running very strong, with companies like Sprint, Google/YouTube, Cox, MTV, Cox, PBS, NY Times, Morgan Stanley, Hearst, Showtime, Hulu, Telemundo, Cisco, HBO, Motorola and many others all represented. Register now!
Categories: Aggregators, Branded Entertainment, Events, FIlms, Studios
Topics: CollegeHumor.com, comScore, Hulu, Mekanism, Netflix, The Onion, VideoSchmooze, Wired, YouTube
-
4 Items Worth Noting from the Week of August 31st
Following are 4 news items worth noting from the week of August 31st:
1. Nielsen "Three Screen Report" shows no TV viewing erosion - I was intrigued by Nielsen's new data out this week that showed no erosion in TV viewership year over year. In Q2 '08 TV usage was 139 hours/mo. In Q2 '09 it actually ticked up a bit to 141 hours 3 minutes/mo. Nielsen shows an almost 50% increase in time spent watching video on the Internet, from 2 hours 12 minutes in Q2 '08 to 3 hours 11 minutes in Q2 '09 (it's worth noting that recently comScore pegged online video usage at a far higher level of 8.3 hours/mo raising the question of how to reconcile the two firms' methodologies).
I find it slightly amazing that we still aren't seeing any drop off in TV viewership. Are people really able to expand their media behavior to accommodate all this? Are they multi-tasking more? Is the data incorrect? Who knows. I for one believe that it's practically inevitable that TV viewership numbers are going to come down at some point. We'll see.
2. DivX acquires AnySource - Though relatively small at about $15M, this week's acquisition by DivX of AnySource Media is important and further proof of the jostling for position underway in the "broadband video-to-the-TV" convergence battle (see this week's "First Intel-Powered Convergence Device Being Unveiled in Europe" for more). I wrote about AnySource earlier this year, noting that its "Internet Video Navigator" looked like a content-friendly approach that would be highly beneficial to CE companies launching Internet-enabled TVs. I'm guessing that DivX will seek to license IVN to CE companies as part of a DivX bundle, moving AnySource away from its current ad-based model. With the IBC show starting late next week, I'm anticipating a number of convergence-oriented announcements.
3. iPhone usage swamps AT&T's wireless network - The NY Times carried a great story this week about the frustration some AT&T subscribers are experiencing these days, as data-centric iPhone usage crushes AT&T's network (video is no doubt the biggest culprit). This was entirely predictable and now AT&T is scrambling to upgrade its network to keep up with demand. But with upgrades not planned to be completed until next year, further pain can be expected. I've been enthusiastic about both live and on-demand video applications on the iPhone (and other smartphones as well), but I'm sobered by the reality that these mobile video apps will be for naught if the underlying networks can't handle them.
4. Another great Netflix streaming experience for me, this time in Quechee VT courtesy of Verizon Wireless - Speaking of taxing the network, I was a prime offender of Verizon's wireless network last weekend. While in Quechee, VT (a pretty remote town about 130 miles from Boston) for a friend's wedding, I tethered my Blackberry during downtime and streamed "The Shawshank Redemption" (the best movie ever made) to my PC using Netflix's Watch Instantly. I'm happy to report that it came through without a single hiccup. Beautiful full-screen video quality, audio and video in synch, and totally responsive fast-forwarding and rewinding. I've been very bullish on Netflix's Watch Instantly, and this experience made me even more so.
Per the AT&T issue above, it's quite possible that occupants of neighboring rooms in the inn who were trying to make calls on their Verizon phones while I was watching weren't able to do so. But hey, that was their problem, not mine!
Enjoy the weekend (especially if you're in the U.S. and have Monday off too)!
Categories: Aggregators, Deals & Financings, Devices, Mobile Video
Topics: AnySource, Apple, AT&T, comScore, DivX, Intel, iPhone, Netflix, Nielsen, Verizon Wireless
-
comScore's Online Video Data Charts for Jan '07-July '09 Available for Download
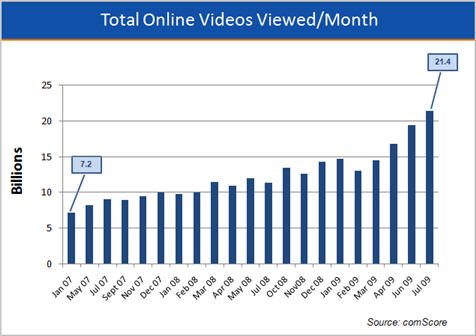
Last Thursday comScore released July 2009 data from its Video Metrix service showing record online video usage for the month. I've been charting comScore's data for 2 1/2 years, making updates each month when comScore provides new data. Today I'm offering these charts as a complimentary download (if you incorporate them into your presentations please identify comScore as the source). Here's an example slide for total online videos viewed per month:
Not surprisingly, a number of content providers have informally told me that their internal data and what comScore reports for them doesn't neatly tie out (anyone who's ever tried to reconcile number from internal analytics, ad servers and external measurement sources can relate to these discrepancies). Nonetheless, comScore's data provides at least one consistently-measured data set on the industry, which is quite useful.
Some of the record July numbers benefit from Michael Jackson's death and also from the lull in original TV episodes. Still, the comScore trendlines are pretty impressive. I share these charts at the beginning of presentations that I often make to industry executives to underscore broadband video's rapid growth. Some of the more noteworthy numbers that are highlighted on the slides include:
- A near tripling of total videos viewed per month from 7.2 billion in Jan '07 to 21.4 billion in July '09.
- A 229% increase in the average number of online videos watched per viewer per month from 59 in Jan '07 to 135 in July '09.
- A 331% jump in the number of minutes of video watched per average viewer per month from 151 minutes (2 hours 31 minutes) in Jan '07 to 500 (8 hours 20 minutes) in July '09.
- Looking just at YouTube, its share of all videos viewed has increased from 16.2% in Jan '07 to 41.9% in July '09. YouTube is the 800 pound gorilla of the market month in and month out. For example, in July '09, the #2 ranked video provider was Viacom Digital with 3.8% share of views, less than a tenth of YouTube's. YouTube accounts for nearly all of Google's 8.9 billion monthly views. To help put that number in perspective, it roughly equals the industry's total views in Sept '07. YouTube is also used more intensively than any other video site, with 74.1 average videos per viewer vs. #2 Viacom Digital with 19.2 average videos per viewer.
- Hulu's monthly videos viewed have increased from 88 million in May '08 to 457 in July '09, a greater than 5x increase in just its first 15 months in existence.
By virtually every measure the industry continues to experience rapid adoption. As I've noted before, in addition to continuing to grow viewership, the industry's key challenge is to further monetize all this video, either through advertising or paid models (subscriptions, pay-per-use or as a value add to other paid services).
What do you think? Post a comment now.
Categories:
Topics: comScore, Hulu, YouTube
-
VideoNuze Report Podcast #29 - August 28, 2009
Daisy Whitney and I are pleased to present the 29th edition of the VideoNuze Report podcast, for August 28, 2009.
In this week's podcast we discuss comScore's rankings of video ad networks' potential reach for July, 2009. I offered a first look at these rankings in Wednesday's post. As I pointed out, these rankings represent the aggregate reach of each ad network's publisher list. This is different from a ranking of actual reach, which comScore is working on, and plans to begin releasing at some point in the near future. Daisy and I remind listeners that potential reach is an imperfect measure, but it is still an important filter for media buyers trying to gain insight into who the major video networks are.
Unrelated, I touch base on last week's podcast in which Daisy and I discussed the Southeastern Conference's shortsighted ban on fan-generated video in stadiums. I raise the topic because earlier this week I had the pleasure of taking my 9 year-old daughter to Fenway Park to see a Red Sox-White Sox game. All around us were people taking pictures and video. And go to YouTube and you'll find plenty of fan video of key Red Sox moments.
Somehow fan video doesn't seem to bother MLB as it does the SEC. I don't claim to understand the difference in thinking, but Daisy notes that MLB has been among the most forward-looking sports leagues around. Daisy is so peeved at the SEC that she's protesting by vowing never to attend an SEC game (a relatively insignificant threat since she's in fact never attended an SEC game and lives on the other side of the country!)
Click here to listen to the podcast (13 minutes, 53 seconds)
Click here for previous podcasts
The VideoNuze Report is available in iTunes...subscribe today!
Categories: Podcasts, Regulation, Sports
Topics: comScore, MLB, Southeastern Conference
-
Unraveling comScore's Monthly Viewership Data for Online Video Ad Networks
A monthly reminder that online video remains a work in progress is comScore's viewership data for online video ad networks. Even as someone who follows the industry closely, I find these reports confusing. The press
 releases often distributed by various online video ad networks touting their progress only adds to the confusion. I touched on this last month, and to clear away some of the fog, last week I spoke to Tania Yuki, comScore's product manager for its Video Metrix measurement service.
 comScore's traffic reports are extremely important for the online video industry's growth because they are a key source of data for advertisers, media buyers, agencies and others looking to tap into this new medium. Ad networks in particular are an important part of the online video ecosystem because they provide significant reach, targeting and delivery technology, all of which are required by prospective advertisers.
A key part of the current confusion is that each month comScore's Video Metrix Ad Focus report - which details the total audience of unique viewers for online properties and ad networks - combines both the actual audience of destination properties with the potential reach of video ad networks. For example, here's the top 10 for April:
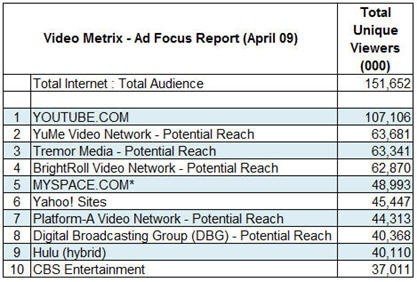
As you can see, 5 of the top 10 listed are ad networks, whose measurement is potential, while the other 5 are actuals. "Potential" is supposed to represent the aggregate number of viewers of all the sites that the ad network has the right to place ads on. However even the validity of this number is amorphous, because networks are only required to provide comScore proof of their relationships if the site accounts for more than 2% of all streaming or web activity.
Recognizing the need to provide more clarity, comScore has recently made available the option for networks to participate in a "hybrid" measurement approach, meant to track networks' actual viewership. To participate, networks need to place a 1x1 pixel, or "beacon" inside any video player where their ads appear. comScore takes the data reported by the beacons and combines it with its 2 million member panel of users whose behavior it tracks. It reconciles differences between the two through a "scaling" process that looks at the intensity of users' non-video behaviors.
To give a sense of the difference between potential and actual, comScore reports BrightRoll - which along with Nabbr are the only video ad networks to have implemented the beacons by April - as having 26M actual viewers vs. the 62M potential reported.
comScore's hybrid approach, which fits with its recently-announced "Media Metrix 360" service, is an important step forward in providing more clarity on how video ad networks are actually performing. Still, as Tania explained, even the hybrid approach has its own idiosyncrasies. For example, some publishers resist having a network's beacon incorporated into their video player, because they want to receive traffic credit themselves. Further, it is a voluntary program. Tania said that in addition to BrightRoll and Nabbr, other networks like BBE, YuMe and Tremor are all working through the implementation currently.
The actual numbers are important for buyers, so that ad networks' viewership can be assessed on an "apple to apples" basis with online properties, as well as non-video options. Tania said that media buyers tell comScore they value both potential and actual numbers. Though that sounds right to me, I think that for the online video medium to mature, buyers are going to put increasing emphasis on actual performance, particularly as it relates to existing media. That's why recent efforts from YuMe and Tremor to translate online video's impact into TV's gross rating points (GRP) paradigm are also important.
In short, comScore seems to be doing its part to improve reporting clarity. However, this isn't going to resolve itself overnight; the market will continue to experience reporting confusion for some time to come.
What do you think? Post a comment now.
Categories: Advertising
Topics: BBE, BrightRoll, comScore, Nabbr, Tremor Media, YuMe
-
comScore Data Shows Tremor Media, Others Gaining in Premium Reach
Amid the steady stream of sneak peek press releases I'm sent each day, one I received late Tuesday from Tremor Media, the video ad network and monetization platform, caught my eye.
The release cited March data from comScore indicating that Tremor's network now had potential reach of 137M unique users and 57M unique video viewers (both unduplicated). The former number is from comScore's Media Metrix Ad Focus report and the latter from its Video Metrix Ad Focus report.
In particular, the latter number stuck out because I recalled comScore numbers from just 2 weeks ago that revealed the viewership for the top 10 video sites. Google (YouTube) was #1 with about 100M viewers, and Fox Interactive (mainly MySpace) was #2 with about half the amount, 55M.
comScore's new data meant that Tremor's potential reach was second only to YouTube's actual reach. And if you make the argument that much of YouTube's viewership is still UGC, while Tremor's network focuses
 solely on premium publishers, Tremor would be #1 in potential reach against premium video, a key point of the release. It's also worth noting that 2 other video ad networks focused on premium publishers also show up in comScore's top 10 for potential unique viewers- BrightRoll with 56M and YuMe with 41M.
 Tremor's VP of Marketing Shane Steele and market research manager Ryan Van Fleet walked me through the data further yesterday.
First, it's important to read these numbers carefully, as there's a little bit of apples vs. oranges going on. The Video Metrix Ad Focus report combines actual viewership by the destination sites (e.g. YouTube, MySpace, Yahoo, Hulu, etc.) with potential viewership by the ad networks. The report clearly denotes what's considered "potential." If I understand it correctly then, the comScore numbers for ad networks should be read as "here's the total potential audience of viewers you have access to." However, what percentage of this accessible audience actually gets an ad served by the ad network is only known by the ad network itself.
VideoNuze readers will recall there's been a lot of sensitivity around these comScore numbers, since last summer a minor kerfuffle broke out over comScore's ranking of YuMe's traffic. Initially it attributed MSN's full audience to YuMe, but later revised YuMe's ranking down by only included pages against which YuMe ads could be served. comScore also stated that on an ongoing basis it would report "potential" reach for ad networks based on documented agreements and "actual" reach for those networks that included certain tags. The new Tremor numbers reflect this potential reach measurement.
It's also important to remember that comScore filters its data to arrive at unduplicated reach. As I understand it that means that if for example Tremor had USAToday.com and Fox.com in its network (note Tremor doesn't disclose its publishers except to its advertisers) and a single user watched video at both sites, the user would only be counted once in Tremor's potential reach. I don't know how exactly comScore de-duplicates viewership, but let's assume it's accurate.
The extent of Tremor's reach (along with BrightRoll's and YuMe's), particularly against premium video is an encouraging sign. I've written in the past that key inhibitors of TV ad dollars moving over to online video are both scale and various friction points in the ad buying process. The comScore data demonstrates that a cluster of ad networks is emerging that can deliver against TV ad buyer's reach expectations, while adding new targeting and reporting capabilities unavailable in TV. There have also been recent enhancements to these companies' reporting/analytics (particularly around GRPs) to synch up with TV ad buyers' expectations.
The online video ad model continues to grow and evolve in spite of the current recession. This is particularly important for expensively-produced premium video where effective online monetization is crucial.
Chime in here with a comment if you think the comScore data or its implications needs further clarification.
Categories: Advertising
Topics: BrightRoll, comScore, Tremor Media, YuMe
-
YuMe/Mindshare's iGRP is Another Important Building Block for Video Ads
This week's announcement by YuMe and Mindshare to introduce an "iGRP" calculation for online video ad campaigns is another important building block in the online video industry's maturation process. Under the plan, YuMe and Mindshare will offer a reach and frequency metric for ad campaigns running across YuMe's network, which will correlate to GRPs that media planners use for TV ads. I spoke to YuMe's president and co-founder Jayant Kadambi about the iGRP plan yesterday.
Jayant explained that as the online video medium has grown, YuMe's sales team has begun interacting with more and more TV ad buyers, in addition to online ad buyers it customarily dealt with. While a lot of the
 spending for online video ads is still based on number of uniques and impressions, recently virtually all of the TV ad buyers YuMe deals with have been asking for a way to correlate and compare online video ad buys with TV buys. To address this need YuMe introduced the iGRP calculation a little while back and this week took the wraps off of it publicly. For those interested in understanding GRPs better, and the iGRP calculation, YuMe also released this useful white paper.
The white paper suggests that in addition to measuring reach and frequency, iGRPs can also capture an "interactivity factor" which would measure things like mouseovers, click-throughs and leads. YuMe and Mindshare plan to work with agencies and advertisers on various experiments testing the performance of different ad formats, durations, content types and targeting schemes.
I've believed for a while, as have others, that while there will be experimental ad dollars flowing into online video advertising, in order for the industry to truly scale, it is going to have to draw spending away from TV advertising. This is especially true in the down economy where advertisers are paring budgets, not increasing them. The $60 billion or so that's spent per year on TV ads is a rich pot of gold for online video to tap into. And given how reliant the online video industry is on advertising (vs. the paid model), the urgency to do so is quite high.
But actually making this happen is no easy feat. The TV ad industry is well-understood by all its
 participants, and despite its shortcomings and recent pressures such as surging DVR usage, many in the industry have little incentive to change. As a result, I believe online video ad executives must address and resolve all the friction points in shifting ad spending. Learning to speak in the same language - GRPs in this case - that traditional TV buyers have used in building media plans and doing post-campaign analysis is essential for the online video industry's growth.
YuMe's and Mindshare's GRP plan comes on the heels of Tremor Media's own GRP announcement with comScore from February. No doubt others will follow with their own approaches as well. This will make for a noisy period until the industry coalesces around standard ways of calculating GRPs and other metrics. Nonetheless, this awkward adolescence should be viewed as an expected part of the maturation process for an industry seeking to convert an already massive, and still rapidly growing amount of monthly eyeballs into meaningful ad revenues.
What do you think? Post a comment now.
Categories: Advertising, Analytics
Topics: comScore, Mindshare, Tremor Media, YuMe
-
VideoNuze Report Podcast #12 - April 3, 2009
Below is the 12th edition of the VideoNuze Report podcast, for April 3, 2009.
After a week off, Daisy Whitney and I are back. This week we discuss new comScore data Daisy learned about while attending the OMMA Video conference, which supports the idea of TV ad spending shifting from TV to broadband video. Then we dig deeper into the significance of Disney's deal to bring promotional clips to YouTube, which the companies announced earlier this week. More detail on the deal is also in this post I wrote on Tuesday.
Click the play button to listen to the podcast (13 minutes, 49 seconds):
Click here for previous podcasts
The VideoNuze Report is available in iTunes...subscribe today!
Categories: Podcasts
Topics: comScore, Disney, Podcast, YouTube
-
Tremor Media Raises $18 Million Further Validating Broadband Video's Impact
Tremor Media announced this morning that it has raised a Series C round of $18 million, led by Meritech Capital Partners, with participation from existing investors Canaan Partners, Masthead Venture Partners and European Founders Fund. Tremor has now raised nearly $40 million to date. Tremor's CEO Jason Glickman gave me a short update on the company yesterday and a little more background on the financing.
Tremor believes it is now the largest video ad network, with 1,400 publishing partners aggregating 137 million unique visitors per month. Tremor focuses exclusively on premium video (i.e. non user-generated)
and Jason said the company has access to 1 billion "advertisable impressions" per month. According to Jason, this critical mass has been a big source of the company's recent success as it has been able to appeal to advertisers by segmenting its network to target certain types of users. Jason explained that as Tremor has grown and usage of broadband video has surged, the company has increased its efforts to shift traditional TV ad dollars over. Though it's hard to know exactly what budgets ad dollars were originally earmarked for, based on the size of the RFPs Tremor's responding to, Jason thinks this shift is indeed underway. And as he correctly points out, you don't need a lot of the $70 billion that's spent on TV annually to move over to make a big impact in broadband advertising. To help compete more effectively with TV, Tremor also recently announced that it would use comScore's Post Buy and Ad Effectiveness reports to offer GRP (gross ratings points) campaign metrics.
To give some sense of Tremor's relative size, comScore reported 14.3 billion total U.S. video views in Dec. '08. Of that YouTube accounted for approximately 5.9 billion views. If you assume that somewhere between half and two-thirds of YouTube's views are UGC (and don't even consider UGC views at all other sites), then premium U.S. video views might be somewhere around 11.3-12.3 billion per month. According to these calculations, that would mean Tremor has access to around 8-9% of premium U.S. video views per month.
While acknowledging the economic downturn has created new challenges, Jason said the company has met or beat all of its metrics, is still on track for profitability in '09 and had multiple financing offers. Meritech's media and advertising experience in other portfolio companies (e.g. Facebook, Quigo, Revenue Science, etc.) was a real draw. The funding will be used to build its network, enhance its Acudeo monetization platform and continue international expansion.
There's no denying the economic pain being felt these days, but Tremor's ability to raise, coupled with other market leaders' ability to do so, is solid evidence that the broadband video market is a rare bright spot in the media landscape today. I constantly remind people that the underlying fundamentals of broadband video consumption are only increasing each month. The companies that figure out how to capitalize on these trends will still be able to raise money.
What do you think? Post a comment now.
(Note: Tremor Media is a VideoNuze sponsor)
Categories: Advertising, Deals & Financings
Topics: comScore, Meritech, Tremor Media
-
Crunching comScore's Video Data Yields Market Insights
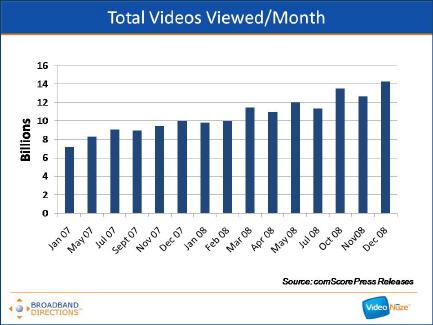
Last week when comScore announced data from its Video Metrix service for December '08, I made a note to myself to go back and look at all the video usage data comScore has released and see what it reveals. Below are 5 charts that I've compiled from comScore's press releases covering January 2007 - December 2008 (note comScore didn't report on every single month during this 24 month period so there are some holes in the graphs).
The first graph shows the growth in total videos viewed per month, roughly doubling from 7.2 billion views in Jan. '07 to 14.3 billion views in Dec. '08.
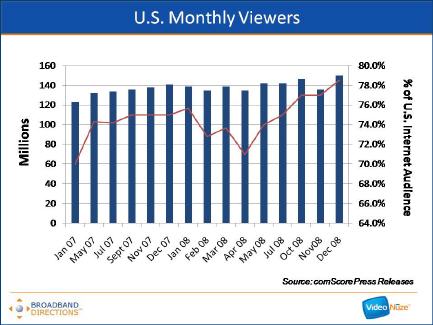
That growth is driven by a number of factors including an increase in the number of monthly viewers from 123 million in Jan. '07 (70% of U.S. Internet users) to 150 million in Dec. '08 (78.5% of U.S. Internet users).
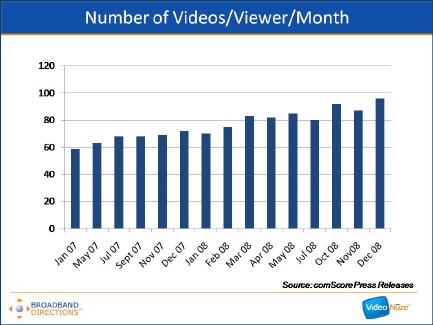
It also reflects an increase in the number of videos viewed per viewer from 59 in Jan. '07 to 96 in Dec. '08.
Which further translates into the growth of total number of minutes the average viewer watched per month from 151 minutes per month in Jan. '07 to 309 minutes per month in Dec. '08.
 Aside from the sheer growth of the market over the last two years, the most striking thing about the comScore data is the growth in usage and market share by YouTube. Back in Jan. '07, YouTube generated approximately 1.2 billion video views per month for a 16.2% share of all videos viewed. Two years later in Dec. '08 YouTube generated approximately 5.9 billion video views per month for a 41.2% market share. YouTube's share growth is staggering: in every month but 1 during this period YouTube increased its sequential monthly views and in all but 3 months it increased its sequential monthly market share.
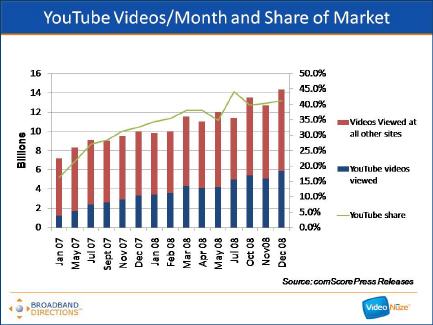
Recall that Google closed on the YouTube acquisition in Nov. '06 and at $1.65 billion, many thought Google had grossly overpaid. Some may still believe this as YouTube is still very much a work in progress in terms of how it generates revenue. But there's no questioning the phenomenal two-year run it has had in terms of its usage and market share growth. This is one of the reasons why I continue to believe YouTube is one of the most powerful platforms for eventually disrupting the traditional video distribution value chain.
If these slides are hard to view, I've uploaded them all to SlideShare.
What do you think? Post a comment now.
Categories: Aggregators
Topics: comScore, Google, YouTube
-
August '08 VideoNuze Recap - 3 Key Topics
Welcome to September. Before looking ahead, here's a quick recap of 3 key topics from August:
1. Advertising model remains in flux
Broadband video advertising was a key story line in August, as it seems to be every month. The industry is rightly focused on the ad model's continued evolution as more and more players in the value chain are increasingly dependent on it. This month, in "Pre-Roll Video Advertising Gets a Boost from 3 Research Studies," I noted how recent research is showing that user acceptance and engagement with the omnipresent pre-roll format is already high and is improving. However, as many readers correctly noted, research from industry participants must be discounted, and some of the metrics cited are not necessarily the best ones to use. I expect we'll see plenty more research - on both sides of pre-roll's efficacy - yet to come.
Meanwhile, comScore added to the confusion around the ad model by first highly ranking YuMe, a large ad network, very high in its reach statistics, only to then reverse itself by downgrading YuMe, before regrouping entirely by introducing a whole new metric for measuring reach. In this post, "comScore Gets Its Act Together on Ad Network Traffic Reporting," I tried to unravel some of this mini-saga. Needless to say, without trustworthy and universally accepted traffic reporting, broadband video is going to have a tough slog ahead.
2. Broadband Olympics are triumphant, but accomplishments are overshadowed
And speaking of a tough slog, the first "Broadband Olympics" were a huge triumph for both NBC and all of its technology partners, yet their accomplishments were overshadowed by a post-mortem revenue estimate by eMarketer suggesting NBC actually made very little money for its efforts. This appeared to knock broadband video advertising back on its heels, yet again, as outsiders pondered whether broadband is being overhyped.
The Olympics became a hobbyhorse of mine in the last 2 weeks as I tried to clarify things in 2 posts, "Why NBCOlympics.com's Video Ad Revenues Don't Matter" part 1 and part 2. These posts triggered a pretty interesting debate about whether technology/operational achievements are noteworthy, if substantial revenues are absent. My answer remains a resounding yes. But having exhausted all my arguments in these prior posts, I'll leave it to you to dig in there if you'd like to learn more about why I feel this way.
3. Broadband's impact is wide-ranging
VideoNuze readers know that another favorite topic of mine is how widespread broadband's impact is poised to become, and in fact already is. A number of August's posts illustrated how broadband's influence is already being felt across a diverse landscape.
Here's a brief sampling: "Vogue.TV's Model.Live: A Magazine Bets Big on Broadband" (magazines), "Tanglewood and BSO Pioneer Broadband Use for Arts/Cultural Organizations," (arts/culture), "American Political Conventions are Next Up to Get Broadband Video Treatment," (politics), "Citysearch Offering Local Merchants Video Enhancement," (local advertising) and "1Cast: A Legit Redlasso Has Tall Mountain to Climb" (local news).
I expect this trend will only accelerate, as more and more industries begin to recognize broadband video's potential benefits.
That's it for August and for the busy summer of '08. Lots more action to coming this fall!
Categories: Advertising, Analytics, Broadcasters, Magazines, Politics, Sports
Topics: 1Cast, CitySearch, comScore, eMarketer, NBC, RedLasso, Tanglewood, Vogue, YuMe
-
comScore Gets Its Act Together on Ad Network Traffic Reporting
I was pleased to see comScore announce on Tuesday that beginning this month it will report two sets of numbers for online ad networks: "potential reach" and "actual reach."
Potential reach will represent the unduplicated visitors to all sites that an ad network has under contract to
 deliver ads to (based on written documentation), while actual reach will represent the number of ads actually served (based on a tagging mechanism that comScore will require the ad networks to implement to be counted). This is a welcome development, particularly in the intensely competitive video ad network space. In fact, it seems such an obvious move, one wonders why comScore has been so tardy in introducing it.
 Followers of VideoNuze and other industry blogs know that comScore's measurement deficiencies recently set off a tempest after comScore ranked YuMe, one of the large video ad networks, #8 in reach in its Ad Focus report. With YuMe trumpeting its ranking, other industry players challenged it by noting that the full audience of MSN (a site that YuMe serves ads to) had been counted. The confusion was caused by the fact that comScore had not been delineating "potential" from "actual" reach or providing apples-to-apples numbers for all networks. Chastened, comScore re-ranked YuMe, sending it plummeting in the rankings.
All of this of course only served to create more confusion for media buyers who are trying to cobble together media plans that achieve their broadband video reach and frequency goals within budget, while minimizing their time invested. Though I'm a huge advocate of the ad-supported model dominating the broadband video landscape well into the future, I'm cognizant that the friction media buyers currently encounter is the single biggest challenge the ad model currently faces in its bid to scale and redirect spending from traditional outlets.
So comScore's new reporting is a step forward after two recent steps back. Let's hope for more forward progress.
What do you think? Post a comment.
Categories: Advertising
Posts for 'comScore'

Connect with VideoNuze
Exclusive News Roundup
- NFL Makes Its Case to FCC During Regulatory Scrutiny WSJ
- Peacock gains subscribers, but losses widen in Q1 The Streamable
- Comcast beats revenue, earnings expectations as broadband losses improve CNBC
- YouTube Inks Deal Making SiriusXM Exclusive Audio Advertising Rep in U.S. Variety
- Netflix plans to buy historic Radford Studio Center as Hollywood enters new era LA Times
- Peacock’s Ad-Free Tier Coming To Roku Premium Subscriptions Under New Agreement Deadline

