-
Nielsen’s New Viewership Pie Chart is Valuable, But Keep an Eye on Younger Viewers’ Patterns
Late last week Nielsen released The Gauge, a pie chart representation of the total time Americans spent watching cable TV, broadcast TV and streaming services. It is a valuable new way of assessing TV vs. streaming consumption, but it doesn’t show a complete picture of all that’s happening, especially among younger viewers.
The chart showed that despite all the attention paid to streaming services, cable and broadcast networks still received 39% and 25% of viewing time respectively. In particular, for all the ink that’s been spilled covering Disney+’s meteoric growth since launch in late 2019, it still accounts for just 1% of viewership. And for all the billions of dollars Netflix has spent on original content since the “House of Cards” launch over eight years ago, it still accounts for just 6% of viewing time.However, overall, streaming took 26% of viewing time. Nielsen said that’s almost double the 14% it received in 2019, and that it was likely to hit 33% by the end of this year. For anyone in the streaming space, that kind of growth is very encouraging. Another key reason for optimism is that among the top streaming services Nielsen noted all were fully or partially paid not free, except YouTube (and even its 6% share is partly attributable to its paid YouTube TV service).
Buried in the 8% for “Other Streaming” are fast growing free, ad-supported services like Tubi, Pluto, The Roku Channel, IMDb TV and countless others down through the long tail. As I wrote last week, these free services have a significant tailwind at their back as the connected TV advertising flywheel accelerates. Their share of Nielsen’s pie chart is only going to expand in the future.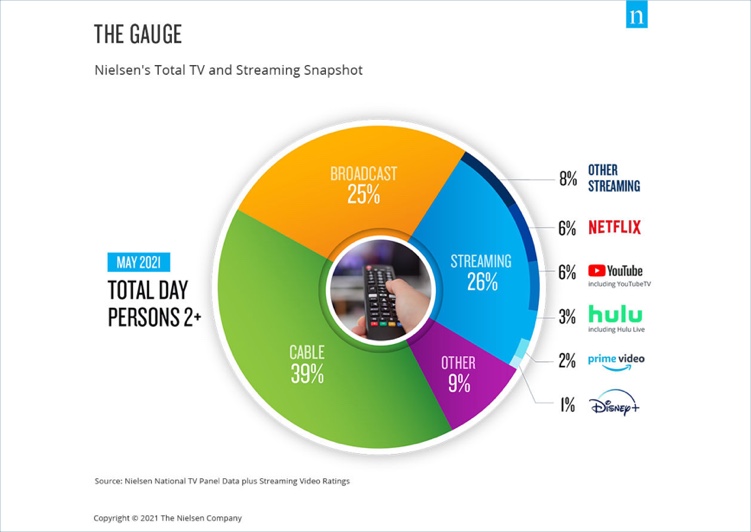
Nielsen kept the first view of The Gauge simple by just revealing one pie chart for Total Day viewing for households with persons 2+. What would have been really illuminating is if Nielsen had shared the pie chart by age groups. What that would have shown for 18-34 year olds is a bigger percentage of time spent streaming than watching cable and broadcast TV - and a strong sense of where the future of TV lies.
In fact Nielsen has provided clues for what the 18-34 year old pie chart would look like in data in its Total Audience Reports. For example, in March 2021, Nielsen said that 18-34 year olds spent less than 8 1/2 hours watching live plus time-shifted TV on a weekly basis compared with almost 35 minutes per week by 50-64 year olds, and 46 1/2 minutes per week by 65+ year olds.
From another vantage point, Bruce Leichtman of Leichtman Research Group shared data at the Connected TV Ad Summit two weeks ago highlighting how much more intensively younger viewers use their connected TVs than older viewers, a pretty good, though not perfect, way of understanding their bias toward streaming vs. cable/broadcast. Bruce found that 54% of 18-34 year olds watch video on a CTV daily, while just 22% of 55+ year olds do so.
Younger viewers consuming more streaming video is not a new story, but it’s an important one to keep in mind when thinking about where the TV industry is going in the future. Nielsen’s new The Gauge snapshot is valuable for getting a quick glance at where viewing stands currently, at a high level. Digging just a little deeper reveals the seismic shift that are underway that affect all players in the ecosystem.Topics: Nielsen
